| Open: | 8.8189 |
| Change: | +0.0113 |
| Volume: | 19,519 |
| Low: | 8.8057 |
| High: | 8.8394 |
| High / Low range: | 0.0337 |
| Type: | Forex |
| Ticker: | CHFHKD |
| ISIN: |
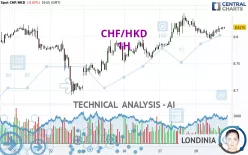
CHF/HKD - 1H - Technical analysis published on 11/28/2024 (GMT)
- 110
- 0
- 11/28/2024 - 19:55
Click here for a new analysis!
- Timeframe : 1H
- - Analysis generated on 11/28/2024 - 19:55
- Status : TARGET REACHED

Summary of the analysis

Additional analysis
Quotes
The CHF/HKD price is 8.8175 HKD. On the day, this instrument lost -0.02% and was between 8.7951 HKD and 8.8202 HKD. This implies that the price is at +0.25% from its lowest and at -0.03% from its highest.A study of price movements over other periods shows the following variations:
Near a new LOW record (1 year)
Type : Bearish
Timeframe : Weekly
Near a new LOW record (1st january)
Type : Bearish
Timeframe : Weekly
Near a new HIGH record (1 month)
Type : Bullish
Timeframe : Weekly
Technical
Technical analysis of CHF/HKD in 1H shows a strongly overall bullish trend. The signals given by moving averages are 89.29% bullish. This strongly bullish trend seems to be running out of steam given the signals being given by short-term moving averages. The Central Indicators market scanner currently does not detect any result that concerns moving averages.
An assessment of technical indicators shows a strong bullish signal.
Caution: the Central Indicators scanner currently detects an excess:
CCI indicator is overbought : over 100
Type : Neutral
Timeframe : 1 hour
Williams %R indicator is overbought : over -20
Type : Neutral
Timeframe : 1 hour
Pivot points : price is over resistance 1
Type : Neutral
Timeframe : Weekly
The Central Patterns scanner, which studies chart patterns, resistances and supports, has identified these signals:
Near horizontal support
Type : Bullish
Timeframe : 1 hour
Near support of triangle
Type : Bullish
Timeframe : 1 hour
Support of channel is broken
Type : Bearish
Timeframe : 1 hour
No result was found by the Central Candlesticks scanner on Japanese candlesticks.
| S3 | S2 | S1 | Price | R1 | R2 | R3 | |
|---|---|---|---|---|---|---|---|
| ProTrendLines | 8.7263 | 8.7577 | 8.8000 | 8.8175 | 8.8229 | 8.8432 | 8.8842 |
| Change (%) | -1.03% | -0.68% | -0.20% | - | +0.06% | +0.29% | +0.76% |
| Change | -0.0912 | -0.0598 | -0.0175 | - | +0.0054 | +0.0257 | +0.0667 |
| Level | Minor | Intermediate | Intermediate | - | Minor | Intermediate | Intermediate |
Pivot points can also be used to set your price objectives. Here is the price situation in relation to pivot points:
| Pivot points | S3 | S2 | S1 | PP | R1 | R2 | R3 |
|---|---|---|---|---|---|---|---|
| Standard | 8.7213 | 8.7508 | 8.7849 | 8.8144 | 8.8485 | 8.8780 | 8.9121 |
| Camarilla | 8.8015 | 8.8073 | 8.8132 | 8.8190 | 8.8248 | 8.8307 | 8.8365 |
| Woodie | 8.7236 | 8.7520 | 8.7872 | 8.8156 | 8.8508 | 8.8792 | 8.9144 |
| Fibonacci | 8.7508 | 8.7751 | 8.7901 | 8.8144 | 8.8387 | 8.8537 | 8.8780 |
| Pivot points | S3 | S2 | S1 | PP | R1 | R2 | R3 |
|---|---|---|---|---|---|---|---|
| Standard | 8.4984 | 8.5945 | 8.6503 | 8.7464 | 8.8022 | 8.8983 | 8.9541 |
| Camarilla | 8.6643 | 8.6783 | 8.6922 | 8.7061 | 8.7200 | 8.7340 | 8.7479 |
| Woodie | 8.4783 | 8.5844 | 8.6302 | 8.7363 | 8.7821 | 8.8882 | 8.9340 |
| Fibonacci | 8.5945 | 8.6525 | 8.6884 | 8.7464 | 8.8044 | 8.8403 | 8.8983 |
| Pivot points | S3 | S2 | S1 | PP | R1 | R2 | R3 |
|---|---|---|---|---|---|---|---|
| Standard | 8.5958 | 8.7643 | 8.8831 | 9.0516 | 9.1704 | 9.3389 | 9.4577 |
| Camarilla | 8.9229 | 8.9492 | 8.9756 | 9.0019 | 9.0282 | 9.0546 | 9.0809 |
| Woodie | 8.5710 | 8.7519 | 8.8583 | 9.0392 | 9.1456 | 9.3265 | 9.4329 |
| Fibonacci | 8.7643 | 8.8741 | 8.9419 | 9.0516 | 9.1614 | 9.2292 | 9.3389 |
Numerical data
The following is the status of the technical indicators and moving averages at the time of publication of this technical analysis:
| RSI (14): | 57.24 | |
| MACD (12,26,9): | 0.0019 | |
| Directional Movement: | 5.7111 | |
| AROON (14): | 35.7143 | |
| DEMA (21): | 8.8142 | |
| Parabolic SAR (0,02-0,02-0,2): | 8.8036 | |
| Elder Ray (13): | 0.0036 | |
| Super Trend (3,10): | 8.7914 | |
| Zig ZAG (10): | 8.8165 | |
| VORTEX (21): | 0.9773 | |
| Stochastique (14,3,5): | 85.99 | |
| TEMA (21): | 8.8119 | |
| Williams %R (14): | -13.06 | |
| Chande Momentum Oscillator (20): | 0.0125 | |
| Repulse (5,40,3): | 0.0591 | |
| ROCnROLL: | 1 | |
| TRIX (15,9): | 0.0013 | |
| Courbe Coppock: | 0.08 |
| MA7: | 8.7806 | |
| MA20: | 8.8326 | |
| MA50: | 8.9712 | |
| MA100: | 9.0065 | |
| MAexp7: | 8.8137 | |
| MAexp20: | 8.8116 | |
| MAexp50: | 8.8044 | |
| MAexp100: | 8.7939 | |
| Price / MA7: | +0.42% | |
| Price / MA20: | -0.17% | |
| Price / MA50: | -1.71% | |
| Price / MA100: | -2.10% | |
| Price / MAexp7: | +0.04% | |
| Price / MAexp20: | +0.07% | |
| Price / MAexp50: | +0.15% | |
| Price / MAexp100: | +0.27% |
About author
Online


Add a comment
Comments
0 comments on the analysis CHF/HKD - 1H