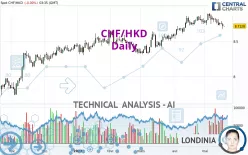
CHF/HKD - Daily - Technical analysis published on 05/18/2023 (GMT)
- 150
- 0
Click here for a new analysis!
- Timeframe : Daily
- - Analysis generated on
- Status : INVALID

Summary of the analysis

Additional analysis
Quotes
CHF/HKD rating 8.7128 HKD. The price registered an increase of +0.00% on the session and was between 8.7081 HKD and 8.7163 HKD. This implies that the price is at +0.05% from its lowest and at -0.04% from its highest.The Central Gaps scanner detects a bearish opening. A small advantage for sellers in the very short term.
Bearish opening
Type : Bearish
Timeframe : Openning
A study of price movements over other periods shows the following variations:
Near a new HIGH record (5 years)
Type : Bullish
Timeframe : Weekly
Near a new HIGH record (1 year)
Type : Bullish
Timeframe : Weekly
Near a new LOW record (1st january)
Type : Bearish
Timeframe : Weekly
Near a new HIGH record (1 month)
Type : Bullish
Timeframe : Weekly
Technical
Technical analysis of CHF/HKD in Daily shows an overall bullish trend. 71.43% of the signals given by moving averages are bullish. Caution: the neutral signals currently given by short-term moving averages show us that the global trend is losing momentum. There is no crossing of moving average by the price or crossing of moving averages between themselves.
In fact, only 9 technical indicators out of 18 studied are currently bearish. But beware of excesses. The Central Indicators scanner currently detects this:
CCI indicator is oversold : under -100
Type : Neutral
Timeframe : Daily
RSI indicator: bullish divergence
Type : Bullish
Timeframe : Daily
Williams %R indicator is oversold : under -80
Type : Neutral
Timeframe : Daily
The Central Patterns scanner, which studies chart patterns, resistances and supports, has identified this signal:
Near support of channel
Type : Bullish
Timeframe : Daily
The Central Candlesticks scanner, specialised in Japanese candlesticks, did not identify any signals.
| S3 | S2 | S1 | Price | R1 | R2 | R3 | |
|---|---|---|---|---|---|---|---|
| ProTrendLines | 8.3312 | 8.4813 | 8.6397 | 8.7128 | 8.8283 | 9.0741 | 10.7929 |
| Change (%) | -4.38% | -2.66% | -0.84% | - | +1.33% | +4.15% | +23.87% |
| Change | -0.3816 | -0.2315 | -0.0731 | - | +0.1155 | +0.3613 | +2.0801 |
| Level | Major | Intermediate | Intermediate | - | Major | Minor | Intermediate |
Attention could also be paid to pivot points to set price objectives:
| Pivot points | S3 | S2 | S1 | PP | R1 | R2 | R3 |
|---|---|---|---|---|---|---|---|
| Standard | 8.5927 | 8.6344 | 8.6737 | 8.7154 | 8.7547 | 8.7964 | 8.8357 |
| Camarilla | 8.6906 | 8.6981 | 8.7055 | 8.7129 | 8.7203 | 8.7278 | 8.7352 |
| Woodie | 8.5914 | 8.6338 | 8.6724 | 8.7148 | 8.7534 | 8.7958 | 8.8344 |
| Fibonacci | 8.6344 | 8.6654 | 8.6845 | 8.7154 | 8.7464 | 8.7655 | 8.7964 |
| Pivot points | S3 | S2 | S1 | PP | R1 | R2 | R3 |
|---|---|---|---|---|---|---|---|
| Standard | 8.5619 | 8.6438 | 8.6860 | 8.7679 | 8.8101 | 8.8920 | 8.9342 |
| Camarilla | 8.6940 | 8.7054 | 8.7167 | 8.7281 | 8.7395 | 8.7509 | 8.7622 |
| Woodie | 8.5420 | 8.6339 | 8.6661 | 8.7580 | 8.7902 | 8.8821 | 8.9143 |
| Fibonacci | 8.6438 | 8.6912 | 8.7205 | 8.7679 | 8.8153 | 8.8446 | 8.8920 |
| Pivot points | S3 | S2 | S1 | PP | R1 | R2 | R3 |
|---|---|---|---|---|---|---|---|
| Standard | 8.2526 | 8.3944 | 8.5834 | 8.7252 | 8.9142 | 9.0560 | 9.2450 |
| Camarilla | 8.6815 | 8.7119 | 8.7422 | 8.7725 | 8.8028 | 8.8332 | 8.8635 |
| Woodie | 8.2763 | 8.4062 | 8.6071 | 8.7370 | 8.9379 | 9.0678 | 9.2687 |
| Fibonacci | 8.3944 | 8.5207 | 8.5988 | 8.7252 | 8.8515 | 8.9296 | 9.0560 |
Numerical data
The following are the details of the technical indicators and moving averages that were collected to generate this technical analysis:
| RSI (14): | 45.65 | |
| MACD (12,26,9): | 0.0097 | |
| Directional Movement: | -7.0501 | |
| AROON (14): | -64.2857 | |
| DEMA (21): | 8.7850 | |
| Parabolic SAR (0,02-0,02-0,2): | 8.8544 | |
| Elder Ray (13): | -0.0482 | |
| Super Trend (3,10): | 8.6532 | |
| Zig ZAG (10): | 8.7143 | |
| VORTEX (21): | 0.9927 | |
| Stochastique (14,3,5): | 15.21 | |
| TEMA (21): | 8.7474 | |
| Williams %R (14): | -82.82 | |
| Chande Momentum Oscillator (20): | -0.0830 | |
| Repulse (5,40,3): | -0.4845 | |
| ROCnROLL: | -1 | |
| TRIX (15,9): | 0.0533 | |
| Courbe Coppock: | 1.20 |
| MA7: | 8.7460 | |
| MA20: | 8.7885 | |
| MA50: | 8.6851 | |
| MA100: | 8.5702 | |
| MAexp7: | 8.7438 | |
| MAexp20: | 8.7593 | |
| MAexp50: | 8.6907 | |
| MAexp100: | 8.5787 | |
| Price / MA7: | -0.38% | |
| Price / MA20: | -0.86% | |
| Price / MA50: | +0.32% | |
| Price / MA100: | +1.66% | |
| Price / MAexp7: | -0.35% | |
| Price / MAexp20: | -0.53% | |
| Price / MAexp50: | +0.25% | |
| Price / MAexp100: | +1.56% |
About author
Online


Add a comment
Comments
0 comments on the analysis CHF/HKD - Daily