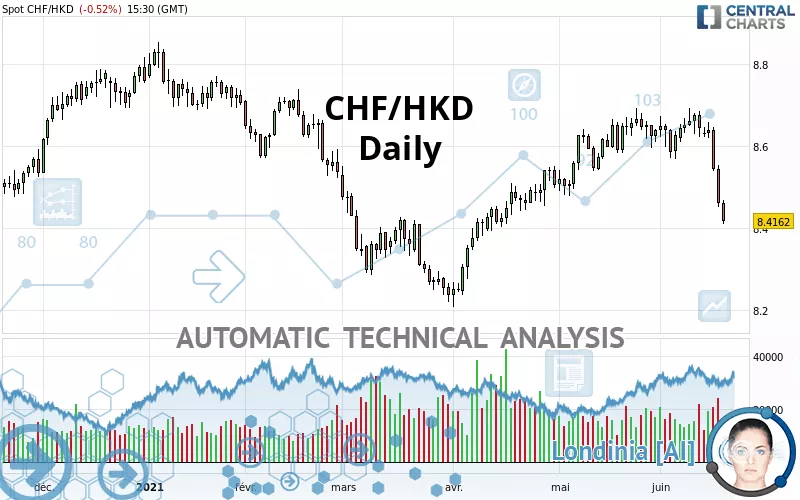
CHF/HKD - Daily - Technical analysis published on 06/18/2021 (GMT)
- 268
- 0
Click here for a new analysis!
- Timeframe : Daily
- - Analysis generated on
- Status : INVALID

Summary of the analysis

Additional analysis
Quotes
CHF/HKD rating 8.4162 HKD. On the day, this instrument lost -0.53% and was traded between 8.4088 HKD and 8.4684 HKD over the period. The price is currently at +0.09% from its lowest and -0.62% from its highest.The Central Gaps scanner detects a bullish opening. A small advantage for buyers in the very short term.
Bullish opening
Type : Bullish
Timeframe : Openning
A study of price movements over other periods shows the following variations:
Near a new HIGH record (5 years)
Type : Bullish
Timeframe : Weekly
Near a new HIGH record (1 month)
Type : Bullish
Timeframe : Weekly
Technical
Technical analysis of this Daily chart of CHF/HKD indicates that the overall trend is bearish. The signals given by moving averages are 64.29% bearish. This bearish trend is reinforced by the strong signals currently being given by short-term moving averages. An assessment of moving averages reveals a bearish signal that could impact this trend:
Bearish price crossover with Moving Average 100
Type : Bearish
Timeframe : Daily
Technical indicators are bearish. There is still some doubt about the decline in the price.
But beware of excesses. The Central Indicators scanner currently detects this:
CCI indicator is oversold : under -100
Type : Neutral
Timeframe : Daily
Williams %R indicator is oversold : under -80
Type : Neutral
Timeframe : Daily
Pivot points : price is under support 1
Type : Neutral
Timeframe : Daily
Pivot points : price is under support 3
Type : Neutral
Timeframe : Weekly
SuperTrend indicator bearish reversal
Type : Bearish
Timeframe : Daily
MACD indicator is back under 0
Type : Bearish
Timeframe : Daily
The Central Patterns scanner, which studies chart patterns, resistances and supports, has identified these signals:
Horizontal support is broken
Type : Bearish
Timeframe : Daily
Support of channel is broken
Type : Bearish
Timeframe : Daily
Support of triangle is broken
Type : Bearish
Timeframe : Daily
The Central Candlesticks scanner, specialised in Japanese candlesticks, did not identify any signals.
| S3 | S2 | S1 | Price | R1 | R2 | R3 | |
|---|---|---|---|---|---|---|---|
| ProTrendLines | 8.0946 | 8.2367 | 8.3415 | 8.4162 | 8.4354 | 8.4813 | 8.5737 |
| Change (%) | -3.82% | -2.13% | -0.89% | - | +0.23% | +0.77% | +1.87% |
| Change | -0.3216 | -0.1795 | -0.0747 | - | +0.0192 | +0.0651 | +0.1575 |
| Level | Minor | Major | Minor | - | Intermediate | Major | Minor |
Pivot points can also be used to set your price objectives. Here is the price situation in relation to pivot points:
| Pivot points | S3 | S2 | S1 | PP | R1 | R2 | R3 |
|---|---|---|---|---|---|---|---|
| Standard | 8.3200 | 8.3852 | 8.4229 | 8.4881 | 8.5258 | 8.5910 | 8.6287 |
| Camarilla | 8.4323 | 8.4417 | 8.4512 | 8.4606 | 8.4700 | 8.4795 | 8.4889 |
| Woodie | 8.3063 | 8.3783 | 8.4092 | 8.4812 | 8.5121 | 8.5841 | 8.6150 |
| Fibonacci | 8.3852 | 8.4245 | 8.4488 | 8.4881 | 8.5274 | 8.5517 | 8.5910 |
| Pivot points | S3 | S2 | S1 | PP | R1 | R2 | R3 |
|---|---|---|---|---|---|---|---|
| Standard | 8.5202 | 8.5647 | 8.6038 | 8.6483 | 8.6874 | 8.7319 | 8.7710 |
| Camarilla | 8.6198 | 8.6275 | 8.6351 | 8.6428 | 8.6505 | 8.6581 | 8.6658 |
| Woodie | 8.5174 | 8.5634 | 8.6010 | 8.6470 | 8.6846 | 8.7306 | 8.7682 |
| Fibonacci | 8.5647 | 8.5967 | 8.6164 | 8.6483 | 8.6803 | 8.7000 | 8.7319 |
| Pivot points | S3 | S2 | S1 | PP | R1 | R2 | R3 |
|---|---|---|---|---|---|---|---|
| Standard | 8.2980 | 8.3876 | 8.5127 | 8.6023 | 8.7274 | 8.8170 | 8.9421 |
| Camarilla | 8.5788 | 8.5984 | 8.6181 | 8.6378 | 8.6575 | 8.6772 | 8.6968 |
| Woodie | 8.3158 | 8.3965 | 8.5305 | 8.6112 | 8.7452 | 8.8259 | 8.9599 |
| Fibonacci | 8.3876 | 8.4696 | 8.5203 | 8.6023 | 8.6843 | 8.7350 | 8.8170 |
Numerical data
The following is the status of the technical indicators and moving averages at the time of publication of this technical analysis:
| RSI (14): | 29.77 | |
| MACD (12,26,9): | -0.0150 | |
| Directional Movement: | -20.4943 | |
| AROON (14): | -50.0000 | |
| DEMA (21): | 8.5813 | |
| Parabolic SAR (0,02-0,02-0,2): | 8.6802 | |
| Elder Ray (13): | -0.1360 | |
| Super Trend (3,10): | 8.6149 | |
| Zig ZAG (10): | 8.4150 | |
| VORTEX (21): | 0.8439 | |
| Stochastique (14,3,5): | 2.41 | |
| TEMA (21): | 8.5374 | |
| Williams %R (14): | -98.17 | |
| Chande Momentum Oscillator (20): | -0.2226 | |
| Repulse (5,40,3): | -2.3307 | |
| ROCnROLL: | 2 | |
| TRIX (15,9): | 0.0255 | |
| Courbe Coppock: | 1.85 |
| MA7: | 8.5726 | |
| MA20: | 8.6176 | |
| MA50: | 8.5650 | |
| MA100: | 8.5139 | |
| MAexp7: | 8.5382 | |
| MAexp20: | 8.5879 | |
| MAexp50: | 8.5672 | |
| MAexp100: | 8.5480 | |
| Price / MA7: | -1.82% | |
| Price / MA20: | -2.34% | |
| Price / MA50: | -1.74% | |
| Price / MA100: | -1.15% | |
| Price / MAexp7: | -1.43% | |
| Price / MAexp20: | -2.00% | |
| Price / MAexp50: | -1.76% | |
| Price / MAexp100: | -1.54% |
About author

Online


Add a comment
Comments
0 comments on the analysis CHF/HKD - Daily