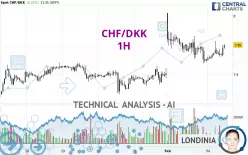
CHF/DKK - 1H - Technical analysis published on 02/04/2025 (GMT)
- 128
- 0
Click here for a new analysis!
- Timeframe : 1H
- - Analysis generated on
- Status : INVALID

Summary of the analysis

Additional analysis
Quotes
The CHF/DKK price is 7.9500 DKK. On the day, this instrument gained +0.32% and was traded between 7.9234 DKK and 7.9572 DKK over the period. The price is currently at +0.34% from its lowest and -0.09% from its highest.So that you have an overall view of the price change, here is a table showing the variations over several periods:
Near a new HIGH record (5 years)
Type : Bullish
Timeframe : Weekly
Near a new HIGH record (1 year)
Type : Bullish
Timeframe : Weekly
Near a new LOW record (1st january)
Type : Bearish
Timeframe : Weekly
Near a new LOW record (1 month)
Type : Bearish
Timeframe : Weekly
Technical
Technical analysis of this 1H chart of CHF/DKK indicates that the overall trend is strongly bullish. 92.86% of the signals given by moving averages are bullish. The overall trend is supported by the strong bullish signals from short-term moving averages. The Central Indicators market scanner is currently detecting a bullish signal that could impact this trend:
Bullish trend reversal : adaptative moving average 20
Type : Bullish
Timeframe : 1 hour
In fact, 14 technical indicators on 18 studied are currently positioned bullish. But beware of excesses. The Central Indicators scanner currently detects this:
CCI indicator is overbought : over 100
Type : Neutral
Timeframe : 1 hour
Williams %R indicator is overbought : over -20
Type : Neutral
Timeframe : 1 hour
Pivot points : price is over resistance 1
Type : Neutral
Timeframe : Weekly
Ichimoku : price is over the cloud
Type : Bullish
Timeframe : 1 hour
An analysis of the price chart with the Central Patterns scanner (detector of chart patterns and resistances and supports) shows a result that can have an impact on the price change:
Near horizontal resistance
Type : Bearish
Timeframe : 1 hour
The Central Candlesticks scanner which studies Japanese candlesticks did not detect anything.
| S3 | S2 | S1 | Price | R1 | R2 | R3 | |
|---|---|---|---|---|---|---|---|
| ProTrendLines | 7.9107 | 7.9361 | 7.9486 | 7.9500 | 7.9657 | 7.9983 | 8.0386 |
| Change (%) | -0.49% | -0.17% | -0.02% | - | +0.20% | +0.61% | +1.11% |
| Change | -0.0393 | -0.0139 | -0.0014 | - | +0.0157 | +0.0483 | +0.0886 |
| Level | Major | Minor | Minor | - | Minor | Major | Major |
To determine price objectives, it is also possible to use the pivot points. Here is the price position in relation to pivot points:
| Pivot points | S3 | S2 | S1 | PP | R1 | R2 | R3 |
|---|---|---|---|---|---|---|---|
| Standard | 7.8093 | 7.8644 | 7.8944 | 7.9495 | 7.9795 | 8.0346 | 8.0646 |
| Camarilla | 7.9011 | 7.9089 | 7.9167 | 7.9245 | 7.9323 | 7.9401 | 7.9479 |
| Woodie | 7.7969 | 7.8581 | 7.8820 | 7.9432 | 7.9671 | 8.0283 | 8.0522 |
| Fibonacci | 7.8644 | 7.8969 | 7.9170 | 7.9495 | 7.9820 | 8.0021 | 8.0346 |
| Pivot points | S3 | S2 | S1 | PP | R1 | R2 | R3 |
|---|---|---|---|---|---|---|---|
| Standard | 7.7941 | 7.8229 | 7.8625 | 7.8913 | 7.9309 | 7.9597 | 7.9993 |
| Camarilla | 7.8832 | 7.8895 | 7.8957 | 7.9020 | 7.9083 | 7.9145 | 7.9208 |
| Woodie | 7.7994 | 7.8256 | 7.8678 | 7.8940 | 7.9362 | 7.9624 | 8.0046 |
| Fibonacci | 7.8229 | 7.8491 | 7.8652 | 7.8913 | 7.9175 | 7.9336 | 7.9597 |
| Pivot points | S3 | S2 | S1 | PP | R1 | R2 | R3 |
|---|---|---|---|---|---|---|---|
| Standard | 7.6739 | 7.7567 | 7.8294 | 7.9122 | 7.9849 | 8.0677 | 8.1404 |
| Camarilla | 7.8592 | 7.8735 | 7.8878 | 7.9020 | 7.9163 | 7.9305 | 7.9448 |
| Woodie | 7.6688 | 7.7542 | 7.8243 | 7.9097 | 7.9798 | 8.0652 | 8.1353 |
| Fibonacci | 7.7567 | 7.8161 | 7.8528 | 7.9122 | 7.9716 | 8.0083 | 8.0677 |
Numerical data
The following is the status of the technical indicators and moving averages at the time of publication of this technical analysis:
| RSI (14): | 60.56 | |
| MACD (12,26,9): | 0.0014 | |
| Directional Movement: | 14.5070 | |
| AROON (14): | 57.1429 | |
| DEMA (21): | 7.9389 | |
| Parabolic SAR (0,02-0,02-0,2): | 7.9835 | |
| Elder Ray (13): | 0.0097 | |
| Super Trend (3,10): | 7.9187 | |
| Zig ZAG (10): | 7.9504 | |
| VORTEX (21): | 1.0185 | |
| Stochastique (14,3,5): | 61.88 | |
| TEMA (21): | 7.9375 | |
| Williams %R (14): | -18.58 | |
| Chande Momentum Oscillator (20): | 0.0248 | |
| Repulse (5,40,3): | 0.1504 | |
| ROCnROLL: | 1 | |
| TRIX (15,9): | -0.0002 | |
| Courbe Coppock: | 0.06 |
| MA7: | 7.9117 | |
| MA20: | 7.9179 | |
| MA50: | 7.9594 | |
| MA100: | 7.9514 | |
| MAexp7: | 7.9403 | |
| MAexp20: | 7.9373 | |
| MAexp50: | 7.9313 | |
| MAexp100: | 7.9212 | |
| Price / MA7: | +0.48% | |
| Price / MA20: | +0.41% | |
| Price / MA50: | -0.12% | |
| Price / MA100: | -0.02% | |
| Price / MAexp7: | +0.12% | |
| Price / MAexp20: | +0.16% | |
| Price / MAexp50: | +0.24% | |
| Price / MAexp100: | +0.36% |
About author
Online


Add a comment
Comments
0 comments on the analysis CHF/DKK - 1H