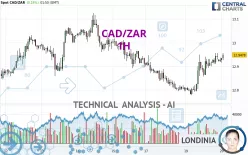
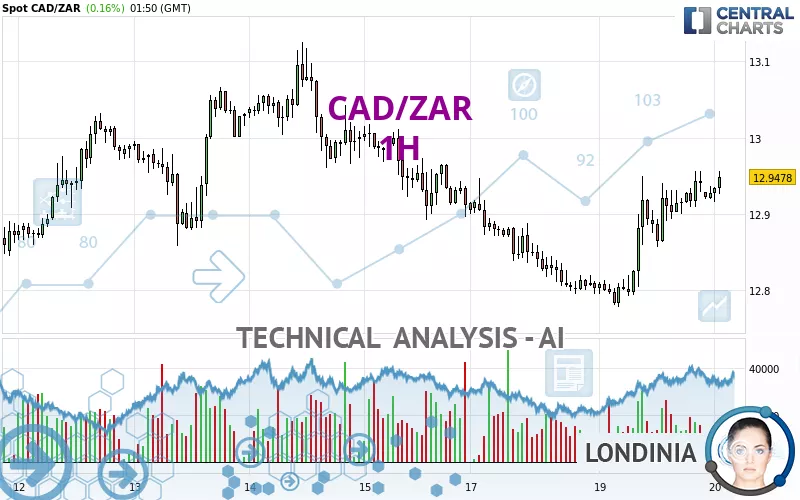
CAD/ZAR - 1H - Technical analysis published on 11/20/2024 (GMT)
- 111
- 0
Click here for a new analysis!
- Timeframe : 1H
- - Analysis generated on
- Status : LEVEL MAINTAINED
Summary of the analysis

Additional analysis
Quotes
CAD/ZAR rating 12.9478 ZAR. The price has increased by +0.16% since the last closing and was traded between 12.9152 ZAR and 12.9561 ZAR over the period. The price is currently at +0.25% from its lowest and -0.06% from its highest.The Central Gaps scanner detects a bearish opening marking the presence of sellers ahead of buyers at the opening but not sufficiently marked to allow the price to register a quotation gap.
Bearish opening
Type : Bearish
Timeframe : Openning
Here is a more detailed summary of the historical variations registered by CAD/ZAR:
Near a new LOW record (1 year)
Type : Bearish
Timeframe : Weekly
Near a new LOW record (1st january)
Type : Bearish
Timeframe : Weekly
Near a new LOW record (1 month)
Type : Bearish
Timeframe : Weekly
Technical
Technical analysis of this 1H chart of CAD/ZAR indicates that the overall trend is bullish. 71.43% of the signals given by moving averages are bullish. This bullish trend is supported by the strong bullish signals given by short-term moving averages. The Central Indicators scanner does not detect any result on moving averages that would impact this trend.
In fact, 13 technical indicators on 18 studied are currently positioned bullish. Caution: the Central Indicators scanner currently detects an excess:
Williams %R indicator is overbought : over -20
Type : Neutral
Timeframe : 1 hour
Parabolic SAR indicator bullish reversal
Type : Bullish
Timeframe : 1 hour
An analysis of the price chart with the Central Patterns scanner (detector of chart patterns and resistances and supports) shows several results that can have an impact on the price change:
Near horizontal resistance
Type : Bearish
Timeframe : 1 hour
Resistance of channel is broken
Type : Bullish
Timeframe : 1 hour
No result was found by the Central Candlesticks scanner on Japanese candlesticks.
| S3 | S2 | S1 | Price | R1 | R2 | R3 | |
|---|---|---|---|---|---|---|---|
| ProTrendLines | 12.6206 | 12.7337 | 12.8581 | 12.9478 | 12.9495 | 13.0837 | 13.2931 |
| Change (%) | -2.53% | -1.65% | -0.69% | - | +0.01% | +1.05% | +2.67% |
| Change | -0.3272 | -0.2141 | -0.0897 | - | +0.0017 | +0.1359 | +0.3453 |
| Level | Minor | Major | Major | - | Intermediate | Major | Intermediate |
Pivot points can also be used to set your price objectives. Here is the price situation in relation to pivot points:
| Pivot points | S3 | S2 | S1 | PP | R1 | R2 | R3 |
|---|---|---|---|---|---|---|---|
| Standard | 12.6398 | 12.7090 | 12.8180 | 12.8872 | 12.9962 | 13.0654 | 13.1744 |
| Camarilla | 12.8781 | 12.8944 | 12.9108 | 12.9271 | 12.9434 | 12.9598 | 12.9761 |
| Woodie | 12.6598 | 12.7190 | 12.8380 | 12.8972 | 13.0162 | 13.0754 | 13.1944 |
| Fibonacci | 12.7090 | 12.7770 | 12.8191 | 12.8872 | 12.9552 | 12.9973 | 13.0654 |
| Pivot points | S3 | S2 | S1 | PP | R1 | R2 | R3 |
|---|---|---|---|---|---|---|---|
| Standard | 12.1420 | 12.3813 | 12.6466 | 12.8859 | 13.1512 | 13.3905 | 13.6558 |
| Camarilla | 12.7731 | 12.8194 | 12.8657 | 12.9119 | 12.9582 | 13.0044 | 13.0507 |
| Woodie | 12.1550 | 12.3878 | 12.6596 | 12.8924 | 13.1642 | 13.3970 | 13.6688 |
| Fibonacci | 12.3813 | 12.5741 | 12.6931 | 12.8859 | 13.0787 | 13.1977 | 13.3905 |
| Pivot points | S3 | S2 | S1 | PP | R1 | R2 | R3 |
|---|---|---|---|---|---|---|---|
| Standard | 12.1329 | 12.3701 | 12.5005 | 12.7377 | 12.8681 | 13.1053 | 13.2357 |
| Camarilla | 12.5299 | 12.5636 | 12.5973 | 12.6310 | 12.6647 | 12.6984 | 12.7321 |
| Woodie | 12.0796 | 12.3434 | 12.4472 | 12.7110 | 12.8148 | 13.0786 | 13.1824 |
| Fibonacci | 12.3701 | 12.5105 | 12.5972 | 12.7377 | 12.8781 | 12.9648 | 13.1053 |
Numerical data
The following is the status of the technical indicators and moving averages at the time of publication of this technical analysis:
| RSI (14): | 62.72 | |
| MACD (12,26,9): | 0.0233 | |
| Directional Movement: | 12.7230 | |
| AROON (14): | 57.1429 | |
| DEMA (21): | 12.9363 | |
| Parabolic SAR (0,02-0,02-0,2): | 12.9152 | |
| Elder Ray (13): | 0.0206 | |
| Super Trend (3,10): | 12.8402 | |
| Zig ZAG (10): | 12.9320 | |
| VORTEX (21): | 1.1783 | |
| Stochastique (14,3,5): | 70.65 | |
| TEMA (21): | 12.9550 | |
| Williams %R (14): | -10.55 | |
| Chande Momentum Oscillator (20): | 0.0242 | |
| Repulse (5,40,3): | 0.1888 | |
| ROCnROLL: | 1 | |
| TRIX (15,9): | 0.0256 | |
| Courbe Coppock: | 0.99 |
| MA7: | 12.9442 | |
| MA20: | 12.7655 | |
| MA50: | 12.8072 | |
| MA100: | 13.0203 | |
| MAexp7: | 12.9323 | |
| MAexp20: | 12.9050 | |
| MAexp50: | 12.8875 | |
| MAexp100: | 12.8913 | |
| Price / MA7: | +0.03% | |
| Price / MA20: | +1.43% | |
| Price / MA50: | +1.10% | |
| Price / MA100: | -0.56% | |
| Price / MAexp7: | +0.12% | |
| Price / MAexp20: | +0.33% | |
| Price / MAexp50: | +0.47% | |
| Price / MAexp100: | +0.44% |
About author
Online


Add a comment
Comments
0 comments on the analysis CAD/ZAR - 1H