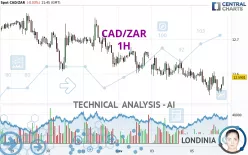
CAD/ZAR - 1H - Technical analysis published on 11/05/2024 (GMT)
- 104
- 0
Click here for a new analysis!
- Timeframe : 1H
- - Analysis generated on
- Status : INVALID

Summary of the analysis

Additional analysis
Quotes
The CAD/ZAR price is 12.5901 ZAR. On the day, this instrument lost -0.04% and was traded between 12.5374 ZAR and 12.6157 ZAR over the period. The price is currently at +0.42% from its lowest and -0.20% from its highest.The Central Gaps scanner detects a bullish opening. A small advantage for buyers in the very short term.
Bullish opening
Type : Bullish
Timeframe : Openning
A study of price movements over other periods shows the following variations:
New LOW record (1 year)
Type : Bearish
Timeframe : Weekly
New LOW record (1st january)
Type : Bearish
Timeframe : Weekly
Near a new HIGH record (1 month)
Type : Bullish
Timeframe : Weekly
New LOW record (1 month)
Type : Bearish
Timeframe : Weekly
Technical
A technical analysis in 1H of this CAD/ZAR chart shows a bearish trend. 71.43% of the signals given by moving averages are bearish. Caution: the neutral signals currently given by short-term moving averages show us that the global trend is losing momentum. The Central Indicators scanner detects a bullish signal on moving averages that could impact this trend:
Bullish price crossover with Moving Average 20
Type : Bullish
Timeframe : 1 hour
Technical indicators are slightly bullish. There is therefore considerable uncertainty about the continuation of the increase.
Central Indicators, the scanner specialised in technical indicators, has identified these signals:
RSI indicator is back over 50
Type : Bullish
Timeframe : 1 hour
MACD crosses UP its Moving Average
Type : Bullish
Timeframe : 1 hour
Momentum indicator is back over 0
Type : Bullish
Timeframe : 1 hour
Williams %R indicator is back over -50
Type : Bullish
Timeframe : 1 hour
The analysis of the price chart with Central Patterns scanners does not return any result.
No result was found by the Central Candlesticks scanner on Japanese candlesticks.
| S3 | S2 | S1 | Price | R1 | R2 | R3 | |
|---|---|---|---|---|---|---|---|
| ProTrendLines | 11.4966 | 12.2101 | 12.5831 | 12.5901 | 12.6072 | 12.6741 | 12.7337 |
| Change (%) | -8.69% | -3.02% | -0.06% | - | +0.14% | +0.67% | +1.14% |
| Change | -1.0935 | -0.3800 | -0.0070 | - | +0.0171 | +0.0840 | +0.1436 |
| Level | Intermediate | Major | Intermediate | - | Intermediate | Intermediate | Minor |
Attention could also be paid to pivot points to set price objectives:
| Pivot points | S3 | S2 | S1 | PP | R1 | R2 | R3 |
|---|---|---|---|---|---|---|---|
| Standard | 12.4975 | 12.5403 | 12.5674 | 12.6102 | 12.6373 | 12.6801 | 12.7072 |
| Camarilla | 12.5753 | 12.5817 | 12.5881 | 12.5945 | 12.6009 | 12.6073 | 12.6137 |
| Woodie | 12.4897 | 12.5364 | 12.5596 | 12.6063 | 12.6295 | 12.6762 | 12.6994 |
| Fibonacci | 12.5403 | 12.5670 | 12.5835 | 12.6102 | 12.6369 | 12.6534 | 12.6801 |
| Pivot points | S3 | S2 | S1 | PP | R1 | R2 | R3 |
|---|---|---|---|---|---|---|---|
| Standard | 12.3474 | 12.4745 | 12.5583 | 12.6854 | 12.7692 | 12.8963 | 12.9801 |
| Camarilla | 12.5842 | 12.6035 | 12.6229 | 12.6422 | 12.6615 | 12.6809 | 12.7002 |
| Woodie | 12.3259 | 12.4637 | 12.5368 | 12.6746 | 12.7477 | 12.8855 | 12.9586 |
| Fibonacci | 12.4745 | 12.5550 | 12.6048 | 12.6854 | 12.7659 | 12.8157 | 12.8963 |
| Pivot points | S3 | S2 | S1 | PP | R1 | R2 | R3 |
|---|---|---|---|---|---|---|---|
| Standard | 12.1329 | 12.3701 | 12.5005 | 12.7377 | 12.8681 | 13.1053 | 13.2357 |
| Camarilla | 12.5299 | 12.5636 | 12.5973 | 12.6310 | 12.6647 | 12.6984 | 12.7321 |
| Woodie | 12.0796 | 12.3434 | 12.4472 | 12.7110 | 12.8148 | 13.0786 | 13.1824 |
| Fibonacci | 12.3701 | 12.5105 | 12.5972 | 12.7377 | 12.8781 | 12.9648 | 13.1053 |
Numerical data
The following are the details of the technical indicators and moving averages that were collected to generate this technical analysis:
| RSI (14): | 51.76 | |
| MACD (12,26,9): | -0.0091 | |
| Directional Movement: | 3.8284 | |
| AROON (14): | -35.7143 | |
| DEMA (21): | 12.5658 | |
| Parabolic SAR (0,02-0,02-0,2): | 12.6032 | |
| Elder Ray (13): | 0.0050 | |
| Super Trend (3,10): | 12.6282 | |
| Zig ZAG (10): | 12.5910 | |
| VORTEX (21): | 0.9485 | |
| Stochastique (14,3,5): | 47.30 | |
| TEMA (21): | 12.5658 | |
| Williams %R (14): | -24.46 | |
| Chande Momentum Oscillator (20): | 0.0159 | |
| Repulse (5,40,3): | 0.2857 | |
| ROCnROLL: | -1 | |
| TRIX (15,9): | -0.0119 | |
| Courbe Coppock: | 0.30 |
| MA7: | 12.6543 | |
| MA20: | 12.7250 | |
| MA50: | 12.8849 | |
| MA100: | 13.0726 | |
| MAexp7: | 12.5714 | |
| MAexp20: | 12.5784 | |
| MAexp50: | 12.5982 | |
| MAexp100: | 12.6267 | |
| Price / MA7: | -0.51% | |
| Price / MA20: | -1.06% | |
| Price / MA50: | -2.29% | |
| Price / MA100: | -3.69% | |
| Price / MAexp7: | +0.15% | |
| Price / MAexp20: | +0.09% | |
| Price / MAexp50: | -0.06% | |
| Price / MAexp100: | -0.29% |
About author
Online


Add a comment
Comments
0 comments on the analysis CAD/ZAR - 1H