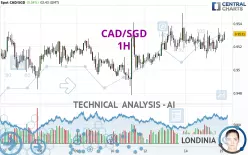
CAD/SGD - 1H - Technical analysis published on 01/15/2025 (GMT)
- 116
- 0
Click here for a new analysis!
- Timeframe : 1H
- - Analysis generated on
- Status : TARGET REACHED

Summary of the analysis

Additional analysis
Quotes
CAD/SGD rating 0.9531 SGD. The price registered an increase of +0.04% on the session and was between 0.9523 SGD and 0.9533 SGD. This implies that the price is at +0.08% from its lowest and at -0.02% from its highest.A bearish opening was detected by the Central Gaps scanner. Sellers are trying to impose a bearish trend in the very short term.
Bearish opening
Type : Bearish
Timeframe : Openning
A study of price movements over other periods shows the following variations:
Near a new LOW record (5 years)
Type : Bearish
Timeframe : Weekly
Near a new LOW record (1 year)
Type : Bearish
Timeframe : Weekly
Near a new LOW record (1st january)
Type : Bearish
Timeframe : Weekly
Near a new LOW record (1 month)
Type : Bearish
Timeframe : Weekly
Technical
A technical analysis in 1H of this CAD/SGD chart shows a strongly bullish trend. The signals given by moving averages are 85.71% bullish. This strongly bullish trend seems to be running out of steam given the signals being given by short-term moving averages. An assessment of moving averages reveals a bullish signal that could impact this trend:
Bullish trend reversal : Moving Average 20
Type : Bullish
Timeframe : 1 hour
An assessment of technical indicators shows a strong bullish signal.
Caution: the Central Indicators scanner currently detects an excess:
CCI indicator is overbought : over 100
Type : Neutral
Timeframe : 1 hour
Williams %R indicator is overbought : over -20
Type : Neutral
Timeframe : 1 hour
Ichimoku : price is over the cloud
Type : Bullish
Timeframe : 1 hour
An analysis of the price chart with the Central Patterns scanner (detector of chart patterns and resistances and supports) shows several results that can have an impact on the price change:
Near horizontal support
Type : Bullish
Timeframe : 1 hour
Support of channel is broken
Type : Bearish
Timeframe : 1 hour
The Central Candlesticks scanner which studies Japanese candlesticks did not detect anything.
| S3 | S2 | S1 | Price | R1 | R2 | R3 | |
|---|---|---|---|---|---|---|---|
| ProTrendLines | 0.9483 | 0.9496 | 0.9510 | 0.9531 | 0.9533 | 0.9541 | 0.9549 |
| Change (%) | -0.50% | -0.37% | -0.22% | - | +0.02% | +0.10% | +0.19% |
| Change | -0.0048 | -0.0035 | -0.0021 | - | +0.0002 | +0.0010 | +0.0018 |
| Level | Intermediate | Minor | Intermediate | - | Intermediate | Minor | Minor |
Pivot points can also be used to set your price objectives. Here is the price situation in relation to pivot points:
| Pivot points | S3 | S2 | S1 | PP | R1 | R2 | R3 |
|---|---|---|---|---|---|---|---|
| Standard | 0.9487 | 0.9498 | 0.9513 | 0.9524 | 0.9539 | 0.9550 | 0.9565 |
| Camarilla | 0.9520 | 0.9522 | 0.9525 | 0.9527 | 0.9529 | 0.9532 | 0.9534 |
| Woodie | 0.9488 | 0.9499 | 0.9514 | 0.9525 | 0.9540 | 0.9551 | 0.9566 |
| Fibonacci | 0.9498 | 0.9508 | 0.9514 | 0.9524 | 0.9534 | 0.9540 | 0.9550 |
| Pivot points | S3 | S2 | S1 | PP | R1 | R2 | R3 |
|---|---|---|---|---|---|---|---|
| Standard | 0.9401 | 0.9434 | 0.9474 | 0.9507 | 0.9547 | 0.9580 | 0.9620 |
| Camarilla | 0.9493 | 0.9500 | 0.9506 | 0.9513 | 0.9520 | 0.9526 | 0.9533 |
| Woodie | 0.9404 | 0.9436 | 0.9477 | 0.9509 | 0.9550 | 0.9582 | 0.9623 |
| Fibonacci | 0.9434 | 0.9462 | 0.9479 | 0.9507 | 0.9535 | 0.9552 | 0.9580 |
| Pivot points | S3 | S2 | S1 | PP | R1 | R2 | R3 |
|---|---|---|---|---|---|---|---|
| Standard | 0.9198 | 0.9300 | 0.9395 | 0.9497 | 0.9592 | 0.9694 | 0.9789 |
| Camarilla | 0.9437 | 0.9455 | 0.9473 | 0.9491 | 0.9509 | 0.9527 | 0.9545 |
| Woodie | 0.9196 | 0.9298 | 0.9393 | 0.9495 | 0.9590 | 0.9692 | 0.9787 |
| Fibonacci | 0.9300 | 0.9375 | 0.9421 | 0.9497 | 0.9572 | 0.9618 | 0.9694 |
Numerical data
The following is the status of the technical indicators and moving averages at the time of publication of this technical analysis:
| RSI (14): | 57.50 | |
| MACD (12,26,9): | 0.0001 | |
| Directional Movement: | 17.9567 | |
| AROON (14): | 57.1429 | |
| DEMA (21): | 0.9526 | |
| Parabolic SAR (0,02-0,02-0,2): | 0.9512 | |
| Elder Ray (13): | 0.0004 | |
| Super Trend (3,10): | 0.9506 | |
| Zig ZAG (10): | 0.9532 | |
| VORTEX (21): | 1.0107 | |
| Stochastique (14,3,5): | 67.95 | |
| TEMA (21): | 0.9527 | |
| Williams %R (14): | -19.23 | |
| Chande Momentum Oscillator (20): | 0.0016 | |
| Repulse (5,40,3): | 0.0986 | |
| ROCnROLL: | 1 | |
| TRIX (15,9): | 0.0008 | |
| Courbe Coppock: | 0.09 |
| MA7: | 0.9516 | |
| MA20: | 0.9480 | |
| MA50: | 0.9520 | |
| MA100: | 0.9538 | |
| MAexp7: | 0.9527 | |
| MAexp20: | 0.9525 | |
| MAexp50: | 0.9522 | |
| MAexp100: | 0.9517 | |
| Price / MA7: | +0.16% | |
| Price / MA20: | +0.54% | |
| Price / MA50: | +0.12% | |
| Price / MA100: | -0.07% | |
| Price / MAexp7: | +0.04% | |
| Price / MAexp20: | +0.06% | |
| Price / MAexp50: | +0.09% | |
| Price / MAexp100: | +0.15% |
About author

Online


Add a comment
Comments
0 comments on the analysis CAD/SGD - 1H