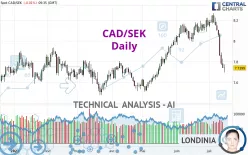
CAD/SEK - Daily - Technical analysis published on 07/17/2023 (GMT)
- 238
- 0
Click here for a new analysis!
- Timeframe : Daily
- - Analysis generated on
- Status : INVALID

Summary of the analysis

Additional analysis
Quotes
The CAD/SEK price is 7.7399 SEK. The price is lower by -0.01% since the last closing and was traded between 7.6959 SEK and 7.7718 SEK over the period. The price is currently at +0.57% from its lowest and -0.41% from its highest.A bearish gap was detected at the opening by the Central Gaps scanner. There are a lot of sellers and they have the upper hand in the very short term.
Opening Gap DOWN
Type : Bearish
Timeframe : Openning
So that you have an overall view of the price change, here is a table showing the variations over several periods:
Near a new LOW record (1 year)
Type : Bearish
Timeframe : Weekly
Near a new LOW record (1st january)
Type : Bearish
Timeframe : Weekly
New LOW record (1 month)
Type : Bearish
Timeframe : Weekly
Technical
A technical analysis in Daily of this CAD/SEK chart shows a slightly bearish trend. Only 53.57% of the signals given by moving averages are bearish. This slightly bearish trend is reinforced by the strong signals currently being given by short-term moving averages. The Central Indicators market scanner currently does not detect any result that concerns moving averages.
In fact, according to the parameters integrated into the Central Analyzer system, 14 technical indicators out of 18 analysed are currently bearish. Caution: the Central Indicators scanner currently detects an excess:
RSI indicator is oversold : under 30
Type : Neutral
Timeframe : Daily
CCI indicator is oversold : under -100
Type : Neutral
Timeframe : Daily
Previous candle closed under Bollinger bands
Type : Neutral
Timeframe : Daily
Williams %R indicator is oversold : under -80
Type : Neutral
Timeframe : Daily
The Central Patterns scanner, which studies chart patterns, resistances and supports, has identified these signals:
Horizontal support is broken
Type : Bearish
Timeframe : Daily
Support of channel is broken
Type : Bearish
Timeframe : Daily
The Central Candlesticks scanner, specialised in Japanese candlesticks, did not identify any signals.
| S3 | S2 | S1 | Price | R1 | R2 | R3 | |
|---|---|---|---|---|---|---|---|
| ProTrendLines | 7.5086 | 7.6226 | 7.6983 | 7.7399 | 7.7545 | 7.8950 | 8.0195 |
| Change (%) | -2.99% | -1.52% | -0.54% | - | +0.19% | +2.00% | +3.61% |
| Change | -0.2313 | -0.1173 | -0.0416 | - | +0.0146 | +0.1551 | +0.2796 |
| Level | Major | Intermediate | Major | - | Intermediate | Intermediate | Major |
To determine price objectives, it is also possible to use the pivot points. Here is the price position in relation to pivot points:
| Pivot points | S3 | S2 | S1 | PP | R1 | R2 | R3 |
|---|---|---|---|---|---|---|---|
| Standard | 7.6184 | 7.6791 | 7.7097 | 7.7704 | 7.8010 | 7.8617 | 7.8923 |
| Camarilla | 7.7153 | 7.7237 | 7.7320 | 7.7404 | 7.7488 | 7.7571 | 7.7655 |
| Woodie | 7.6035 | 7.6716 | 7.6948 | 7.7629 | 7.7861 | 7.8542 | 7.8774 |
| Fibonacci | 7.6791 | 7.7139 | 7.7355 | 7.7704 | 7.8052 | 7.8268 | 7.8617 |
| Pivot points | S3 | S2 | S1 | PP | R1 | R2 | R3 |
|---|---|---|---|---|---|---|---|
| Standard | 7.1460 | 7.4429 | 7.5916 | 7.8885 | 8.0372 | 8.3341 | 8.4828 |
| Camarilla | 7.6179 | 7.6587 | 7.6996 | 7.7404 | 7.7813 | 7.8221 | 7.8629 |
| Woodie | 7.0720 | 7.4059 | 7.5176 | 7.8515 | 7.9632 | 8.2971 | 8.4088 |
| Fibonacci | 7.4429 | 7.6131 | 7.7183 | 7.8885 | 8.0587 | 8.1639 | 8.3341 |
| Pivot points | S3 | S2 | S1 | PP | R1 | R2 | R3 |
|---|---|---|---|---|---|---|---|
| Standard | 7.7414 | 7.8519 | 8.0042 | 8.1147 | 8.2670 | 8.3775 | 8.5298 |
| Camarilla | 8.0843 | 8.1084 | 8.1325 | 8.1566 | 8.1807 | 8.2048 | 8.2289 |
| Woodie | 7.7624 | 7.8624 | 8.0252 | 8.1252 | 8.2880 | 8.3880 | 8.5508 |
| Fibonacci | 7.8519 | 7.9523 | 8.0143 | 8.1147 | 8.2151 | 8.2771 | 8.3775 |
Numerical data
The following is the status of technical indicators and moving averages registered at the time this technical analysis was created:
| RSI (14): | 26.73 | |
| MACD (12,26,9): | -0.0535 | |
| Directional Movement: | -23.5011 | |
| AROON (14): | -50.0000 | |
| DEMA (21): | 7.9684 | |
| Parabolic SAR (0,02-0,02-0,2): | 8.1493 | |
| Elder Ray (13): | -0.2344 | |
| Super Trend (3,10): | 8.0107 | |
| Zig ZAG (10): | 7.7291 | |
| VORTEX (21): | 0.8387 | |
| Stochastique (14,3,5): | 2.99 | |
| TEMA (21): | 7.8624 | |
| Williams %R (14): | -94.13 | |
| Chande Momentum Oscillator (20): | -0.4679 | |
| Repulse (5,40,3): | -2.8861 | |
| ROCnROLL: | 2 | |
| TRIX (15,9): | 0.0240 | |
| Courbe Coppock: | 5.59 |
| MA7: | 7.9188 | |
| MA20: | 8.0757 | |
| MA50: | 7.9863 | |
| MA100: | 7.8214 | |
| MAexp7: | 7.8804 | |
| MAexp20: | 8.0061 | |
| MAexp50: | 7.9732 | |
| MAexp100: | 7.9017 | |
| Price / MA7: | -2.26% | |
| Price / MA20: | -4.16% | |
| Price / MA50: | -3.09% | |
| Price / MA100: | -1.04% | |
| Price / MAexp7: | -1.78% | |
| Price / MAexp20: | -3.32% | |
| Price / MAexp50: | -2.93% | |
| Price / MAexp100: | -2.05% |
About author
Online


Add a comment
Comments
0 comments on the analysis CAD/SEK - Daily