CAD/JPY - Daily - Technical analysis published on 12/21/2024 (GMT)
- 215
- 0
Click here for a new analysis!
- Timeframe : Daily
- - Analysis generated on
- Status : TARGET REACHED

Summary of the analysis

Additional analysis
Quotes
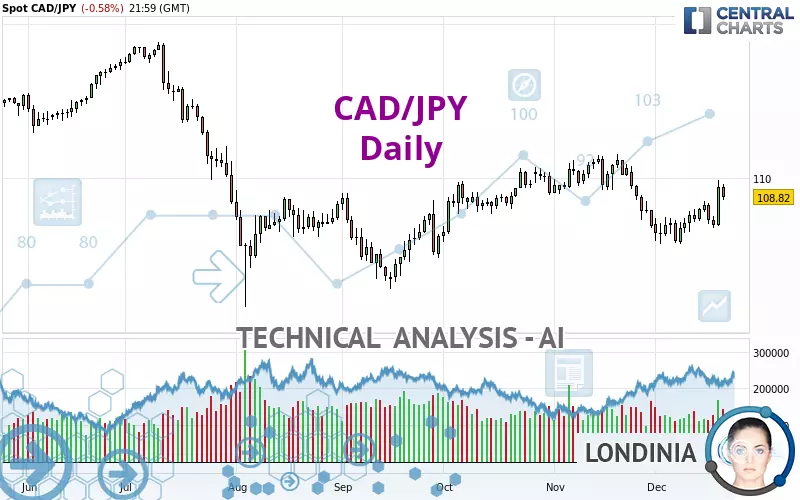
CAD/JPY rating 108.82 JPY. On the day, this instrument lost -0.58% with the lowest point at 108.61 JPY and the highest point at 109.63 JPY. The deviation from the price is +0.19% for the low point and -0.74% for the high point.The Central Gaps scanner detects a bullish opening. A small advantage for buyers in the very short term.
Bullish opening
Type : Bullish
Timeframe : Openning
So that you have an overall view of the price change, here is a table showing the variations over several periods:
Near a new LOW record (1 month)
Type : Bearish
Timeframe : Weekly
Technical
A technical analysis in Daily of this CAD/JPY chart shows a slightly bullish trend. Only 50.00% of the signals given by moving averages are bullish. This slightly bullish trend is not supported by the signals currently being given by short-term moving averages. An assessment of moving averages reveals several bearish and bullish signals:
Bullish trend reversal : Moving Average 50
Type : Bullish
Timeframe : Daily
Bullish trend reversal : Moving Average 100
Type : Bullish
Timeframe : Daily
Bullish trend reversal : adaptative moving average 20
Type : Bullish
Timeframe : Daily
Bullish trend reversal : adaptative moving average 50
Type : Bullish
Timeframe : Daily
Bearish price crossover with Moving Average 50
Type : Bearish
Timeframe : Daily
Bearish price crossover with adaptative moving average 100
Type : Bearish
Timeframe : Daily
Technical indicators are strongly bullish, suggesting that the price increase should continue.
But beware of excesses. The Central Indicators scanner currently detects this:
CCI indicator is overbought : over 100
Type : Neutral
Timeframe : Daily
Pivot points : price is over resistance 1
Type : Neutral
Timeframe : Weekly
An analysis of the price chart with the Central Patterns scanner (detector of chart patterns and resistances and supports) shows several results that can have an impact on the price change:
Near horizontal resistance
Type : Bearish
Timeframe : Daily
Resistance of channel is broken
Type : Bullish
Timeframe : Daily
The Central Candlesticks scanner, specialised in Japanese candlesticks, did not identify any signals.
| S3 | S2 | S1 | Price | R1 | R2 | R3 | |
|---|---|---|---|---|---|---|---|
| ProTrendLines | 103.63 | 106.14 | 108.69 | 108.82 | 109.98 | 111.26 | 113.43 |
| Change (%) | -4.77% | -2.46% | -0.12% | - | +1.07% | +2.24% | +4.24% |
| Change | -5.19 | -2.68 | -0.13 | - | +1.16 | +2.44 | +4.61 |
| Level | Minor | Major | Major | - | Major | Major | Minor |
To determine price objectives, it is also possible to use the pivot points. Here is the price position in relation to pivot points:
| Pivot points | S3 | S2 | S1 | PP | R1 | R2 | R3 |
|---|---|---|---|---|---|---|---|
| Standard | 107.39 | 108.00 | 108.41 | 109.02 | 109.43 | 110.04 | 110.45 |
| Camarilla | 108.54 | 108.63 | 108.73 | 108.82 | 108.91 | 109.01 | 109.10 |
| Woodie | 107.29 | 107.95 | 108.31 | 108.97 | 109.33 | 109.99 | 110.35 |
| Fibonacci | 108.00 | 108.39 | 108.63 | 109.02 | 109.41 | 109.65 | 110.04 |
| Pivot points | S3 | S2 | S1 | PP | R1 | R2 | R3 |
|---|---|---|---|---|---|---|---|
| Standard | 103.98 | 105.39 | 107.10 | 108.51 | 110.22 | 111.63 | 113.34 |
| Camarilla | 107.96 | 108.25 | 108.53 | 108.82 | 109.11 | 109.39 | 109.68 |
| Woodie | 104.14 | 105.47 | 107.26 | 108.59 | 110.38 | 111.71 | 113.50 |
| Fibonacci | 105.39 | 106.58 | 107.32 | 108.51 | 109.70 | 110.44 | 111.63 |
| Pivot points | S3 | S2 | S1 | PP | R1 | R2 | R3 |
|---|---|---|---|---|---|---|---|
| Standard | 100.49 | 103.63 | 105.28 | 108.42 | 110.07 | 113.21 | 114.86 |
| Camarilla | 105.61 | 106.05 | 106.49 | 106.93 | 107.37 | 107.81 | 108.25 |
| Woodie | 99.75 | 103.26 | 104.54 | 108.05 | 109.33 | 112.84 | 114.12 |
| Fibonacci | 103.63 | 105.46 | 106.59 | 108.42 | 110.25 | 111.38 | 113.21 |
Numerical data
The following is the status of the technical indicators and moving averages at the time of publication of this technical analysis:
| RSI (14): | 53.55 | |
| MACD (12,26,9): | -0.2000 | |
| Directional Movement: | 4.12 | |
| AROON (14): | 57.15 | |
| DEMA (21): | 107.68 | |
| Parabolic SAR (0,02-0,02-0,2): | 106.79 | |
| Elder Ray (13): | 1.17 | |
| Super Trend (3,10): | 109.95 | |
| Zig ZAG (10): | 108.82 | |
| VORTEX (21): | 0.9400 | |
| Stochastique (14,3,5): | 68.64 | |
| TEMA (21): | 107.67 | |
| Williams %R (14): | -26.20 | |
| Chande Momentum Oscillator (20): | 1.83 | |
| Repulse (5,40,3): | 0.7300 | |
| ROCnROLL: | 1 | |
| TRIX (15,9): | -0.0700 | |
| Courbe Coppock: | 0.61 |
| MA7: | 108.02 | |
| MA20: | 107.58 | |
| MA50: | 108.95 | |
| MA100: | 107.85 | |
| MAexp7: | 108.14 | |
| MAexp20: | 108.05 | |
| MAexp50: | 108.42 | |
| MAexp100: | 108.90 | |
| Price / MA7: | +0.74% | |
| Price / MA20: | +1.15% | |
| Price / MA50: | -0.12% | |
| Price / MA100: | +0.90% | |
| Price / MAexp7: | +0.63% | |
| Price / MAexp20: | +0.71% | |
| Price / MAexp50: | +0.37% | |
| Price / MAexp100: | -0.07% |
News
The latest news and videos published on CAD/JPY at the time of the analysis were as follows:
-
 CAD/JPY Forecast December 11, 2024
-
CAD/JPY Forecast November 29, 2024
-
CAD/JPY Forecast November 22, 2024
-
CAD/JPY Forecast November 14, 2024
-
CAD/JPY Forecast November 7, 2024
About author

Online


Add a comment
Comments
0 comments on the analysis CAD/JPY - Daily