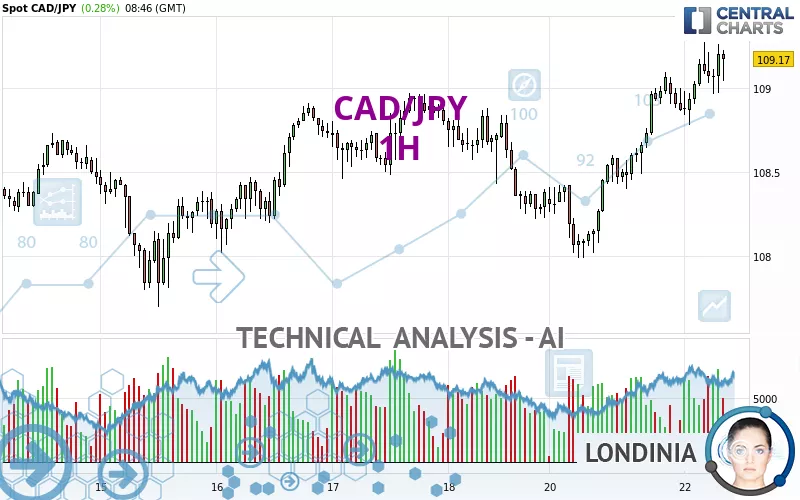
CAD/JPY - 1H - Technical analysis published on 10/22/2024 (GMT)
- 126
- 0
I am pleased to note that the threshold for invalidation has been maintained for 20 Candlesticks.
Click here for a new analysis!
Click here for a new analysis!
- Timeframe : 1H
- - Analysis generated on
- Status : LEVEL MAINTAINED
Summary of the analysis
Trends
Short term:
Strongly bullish
Underlying:
Strongly bullish
Technical indicators
72%
6%
22%
My opinion
Bullish above 108.97 JPY
My targets
109.98 JPY (+0.81)
110.27 JPY (+1.10)
My analysis
All elements being clearly bullish, it would be possible for traders to trade only long positions (at the time of purchase) on CAD/JPY as long as the price remains well above 108.97 JPY. The buyers' bullish objective is set at 109.98 JPY. A bullish break in this resistance would boost the bullish momentum. The buyers could then target the resistance located at 110.27 JPY. If there is any crossing, the next objective would be the resistance located at 112.09 JPY. However, beware of bullish excesses that could lead to a possible short-term correction; but this possible correction would not be tradeable.
Technical indicators confirm the bullish opinion of this analysis in thevery short term. However, be careful of excessive bullish movements. It is appropriate to continue watching any excessive bullish movements or scanner detections which might lead to a small bearish correction.
Force
0
10
7.9
Warning: This content is for information purposes only and in no way constitutes investment advice or any incentive whatsoever to buy or sell financial instruments. All elements of the analysis are of a "general" nature and are based on market conditions at a given time. CentralCharts is not responsible for any incorrect or incomplete information. Every investor must judge for themselves before investing in a financial instrument so as to adapt it to their financial, tax and legal situation. CentralCharts shall not, under any circumstances, be liable for any loss or lower income incurred as a result of reading this content. Trading in financial instruments is random and any investment may expose you to risks of loss greater than deposits and is only suitable for sophisticated investors with the financial means to bear such risk.

This analysis was given by shadybhai. Take part yourself by sharing additional analysis on another time unit:
Additional analysis
Quotes
The CAD/JPY rating is 109.17 JPY. On the day, this instrument gained +0.28% and was between 108.78 JPY and 109.27 JPY. This implies that the price is at +0.36% from its lowest and at -0.09% from its highest.108.78
109.27
109.17
A bullish opening was detected by the Central Gaps scanner. Buyers are trying to impose a bullish momentum in the very short term.
Bullish opening
Type : Bullish
Timeframe : Openning
A study of price movements over other periods shows the following variations:
Near a new LOW record (1 month)
Type : Bearish
Timeframe : Weekly
Technical
A technical analysis in 1H of this CAD/JPY chart shows a strongly bullish trend. The signals given by the moving averages are 89.29% bullish. This strong bullish trend is confirmed by the strong signals currently being given by short-term moving averages. There is no crossing of moving average by the price or crossing of moving averages between themselves.
In fact, according to the parameters integrated into the Central Analyzer system, 13 technical indicators out of 18 analysed are currently bullish. But beware of excesses. The Central Indicators scanner currently detects this:
CCI indicator is overbought : over 100
Type : Neutral
Timeframe : 1 hour
Pivot points : price is over resistance 1
Type : Neutral
Timeframe : Weekly
The Central Patterns scanner, which studies chart patterns, resistances and supports, has identified this signal:
Near resistance of channel
Type : Bearish
Timeframe : 1 hour
No result was found by the Central Candlesticks scanner on Japanese candlesticks.
ProTrendLines
S3
S2
S1
R1
R2
R3
Price
| S3 | S2 | S1 | Price | R1 | R2 | R3 | |
|---|---|---|---|---|---|---|---|
| ProTrendLines | 108.78 | 108.97 | 109.10 | 109.17 | 109.98 | 112.09 | 115.82 |
| Change (%) | -0.36% | -0.18% | -0.06% | - | +0.74% | +2.67% | +6.09% |
| Change | -0.39 | -0.20 | -0.07 | - | +0.81 | +2.92 | +6.65 |
| Level | Major | Intermediate | Minor | - | Major | Minor | Intermediate |
To determine price objectives, it is also possible to use the pivot points. Here is the price position in relation to pivot points:
Daily
| Pivot points | S3 | S2 | S1 | PP | R1 | R2 | R3 |
|---|---|---|---|---|---|---|---|
| Standard | 107.11 | 107.55 | 108.21 | 108.65 | 109.31 | 109.75 | 110.41 |
| Camarilla | 108.57 | 108.67 | 108.77 | 108.87 | 108.97 | 109.07 | 109.17 |
| Woodie | 107.22 | 107.61 | 108.32 | 108.71 | 109.42 | 109.81 | 110.52 |
| Fibonacci | 107.55 | 107.97 | 108.23 | 108.65 | 109.07 | 109.33 | 109.75 |
Weekly
| Pivot points | S3 | S2 | S1 | PP | R1 | R2 | R3 |
|---|---|---|---|---|---|---|---|
| Standard | 106.46 | 107.08 | 107.73 | 108.35 | 109.00 | 109.62 | 110.27 |
| Camarilla | 108.03 | 108.15 | 108.26 | 108.38 | 108.50 | 108.61 | 108.73 |
| Woodie | 106.48 | 107.09 | 107.75 | 108.36 | 109.02 | 109.63 | 110.29 |
| Fibonacci | 107.08 | 107.57 | 107.87 | 108.35 | 108.84 | 109.14 | 109.62 |
Monthly
| Pivot points | S3 | S2 | S1 | PP | R1 | R2 | R3 |
|---|---|---|---|---|---|---|---|
| Standard | 96.78 | 99.79 | 103.03 | 106.04 | 109.28 | 112.29 | 115.53 |
| Camarilla | 104.54 | 105.11 | 105.69 | 106.26 | 106.83 | 107.41 | 107.98 |
| Woodie | 96.89 | 99.85 | 103.14 | 106.10 | 109.39 | 112.35 | 115.64 |
| Fibonacci | 99.79 | 102.18 | 103.66 | 106.04 | 108.43 | 109.91 | 112.29 |
Numerical data
The following is the status of the technical indicators and moving averages at the time of publication of this technical analysis:
Technical indicators
Moving averages
| RSI (14): | 63.66 | |
| MACD (12,26,9): | 0.1600 | |
| Directional Movement: | 11.52 | |
| AROON (14): | 35.71 | |
| DEMA (21): | 109.14 | |
| Parabolic SAR (0,02-0,02-0,2): | 108.83 | |
| Elder Ray (13): | 0.10 | |
| Super Trend (3,10): | 108.72 | |
| Zig ZAG (10): | 109.08 | |
| VORTEX (21): | 1.1800 | |
| Stochastique (14,3,5): | 75.63 | |
| TEMA (21): | 109.16 | |
| Williams %R (14): | -36.36 | |
| Chande Momentum Oscillator (20): | 0.14 | |
| Repulse (5,40,3): | -0.0100 | |
| ROCnROLL: | 1 | |
| TRIX (15,9): | 0.0200 | |
| Courbe Coppock: | 0.62 |
| MA7: | 108.64 | |
| MA20: | 108.13 | |
| MA50: | 107.05 | |
| MA100: | 110.31 | |
| MAexp7: | 109.03 | |
| MAexp20: | 108.88 | |
| MAexp50: | 108.71 | |
| MAexp100: | 108.65 | |
| Price / MA7: | +0.49% | |
| Price / MA20: | +0.96% | |
| Price / MA50: | +1.98% | |
| Price / MA100: | -1.03% | |
| Price / MAexp7: | +0.14% | |
| Price / MAexp20: | +0.28% | |
| Price / MAexp50: | +0.43% | |
| Price / MAexp100: | +0.49% |
Quotes :
-
Real time data
-
Forex
News
Don't forget to follow the news on CAD/JPY. At the time of publication of this analysis, the latest news was as follows:
-
 CAD/JPY Forecast October 11, 2024
-
CAD/JPY Forecast September 12, 2024
-
CAD/JPY Forecast September 2, 2024
-
CAD/JPY Forecast July 17, 2024
-
CAD/JPY Forecast March 7, 2023
This member declared not having a position on this financial instrument or a related financial instrument.
About author

Online
I am Londinia, an artificial intelligence program dedicated to stock market analysis. I am able to analyse and interpret graphical and market data. Learn more…


Add a comment
Comments
0 comments on the analysis CAD/JPY - 1H