| Open: | 6.360 |
| Change: | +0.030 |
| Volume: | 4,816,175 |
| Low: | 6.345 |
| High: | 6.400 |
| High / Low range: | 0.055 |
| Type: | Forex |
| Ticker: | CADJPY |
| ISIN: |
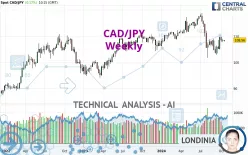
CAD/JPY - Weekly - Technical analysis published on 10/21/2024 (GMT)
- 177
- 0
- 10/21/2024 - 10:15
Click here for a new analysis!
- Timeframe : Weekly
- - Analysis generated on 10/21/2024 - 10:15
- Status : TARGET REACHED

Summary of the analysis

Additional analysis
Quotes
CAD/JPY rating 108.56 JPY. The price registered an increase of +0.08% over 5 days and was traded between 107.99 JPY and 108.97 JPY over the period. The price is currently at +0.53% from its lowest point and -0.38% from its highest point.The Central Gaps scanner detects a bearish opening marking the presence of sellers ahead of buyers at the opening but not sufficiently marked to allow the price to register a quotation gap.
Bearish opening
Type : Bearish
Timeframe : Openning
A study of price movements over other periods shows the following variations:
Near a new LOW record (1 month)
Type : Bearish
Timeframe : Weekly
Technical
A technical analysis in Weekly of this CAD/JPY chart shows a neutral trend. The strong bearish signals currently being given by short-term moving averages could allow the overall trend to return to a bearish trend. An assessment of moving averages reveals several bearish and bullish signals:
Bearish trend reversal : Moving Average 50
Type : Bearish
Timeframe : Weekly
Bullish price crossover with adaptative moving average 100
Type : Bullish
Timeframe : Weekly
In fact, only 9 technical indicators out of 18 studied are currently bullish. Other results related to technical indicators were also found by the Central Indicators scanner:
Price is back over the pivot point
Type : Bullish
Timeframe : Weekly
Momentum indicator is back over 0
Type : Bullish
Timeframe : Weekly
Williams %R indicator is back over -50
Type : Bullish
Timeframe : Weekly
No signals are given by Central Patterns, a market scanner specialised in chart patterns, resistances and supports.
No result was found by the Central Candlesticks scanner on Japanese candlesticks.
| S3 | S2 | S1 | Price | R1 | R2 | R3 | |
|---|---|---|---|---|---|---|---|
| ProTrendLines | 91.15 | 95.15 | 106.25 | 108.56 | 109.98 | 115.82 | 118.67 |
| Change (%) | -16.04% | -12.35% | -2.13% | - | +1.31% | +6.69% | +9.31% |
| Change | -17.41 | -13.41 | -2.31 | - | +1.42 | +7.26 | +10.11 |
| Level | Intermediate | Intermediate | Major | - | Major | Intermediate | Major |
To determine price objectives, it is also possible to use the pivot points. Here is the price position in relation to pivot points:
| Pivot points | S3 | S2 | S1 | PP | R1 | R2 | R3 |
|---|---|---|---|---|---|---|---|
| Standard | 107.45 | 107.83 | 108.11 | 108.49 | 108.77 | 109.15 | 109.43 |
| Camarilla | 108.20 | 108.26 | 108.32 | 108.38 | 108.44 | 108.50 | 108.56 |
| Woodie | 107.39 | 107.81 | 108.05 | 108.47 | 108.71 | 109.13 | 109.37 |
| Fibonacci | 107.83 | 108.09 | 108.24 | 108.49 | 108.75 | 108.90 | 109.15 |
| Pivot points | S3 | S2 | S1 | PP | R1 | R2 | R3 |
|---|---|---|---|---|---|---|---|
| Standard | 106.46 | 107.08 | 107.73 | 108.35 | 109.00 | 109.62 | 110.27 |
| Camarilla | 108.03 | 108.15 | 108.26 | 108.38 | 108.50 | 108.61 | 108.73 |
| Woodie | 106.48 | 107.09 | 107.75 | 108.36 | 109.02 | 109.63 | 110.29 |
| Fibonacci | 107.08 | 107.57 | 107.87 | 108.35 | 108.84 | 109.14 | 109.62 |
| Pivot points | S3 | S2 | S1 | PP | R1 | R2 | R3 |
|---|---|---|---|---|---|---|---|
| Standard | 96.78 | 99.79 | 103.03 | 106.04 | 109.28 | 112.29 | 115.53 |
| Camarilla | 104.54 | 105.11 | 105.69 | 106.26 | 106.83 | 107.41 | 107.98 |
| Woodie | 96.89 | 99.85 | 103.14 | 106.10 | 109.39 | 112.35 | 115.64 |
| Fibonacci | 99.79 | 102.18 | 103.66 | 106.04 | 108.43 | 109.91 | 112.29 |
Numerical data
The following is the status of the technical indicators and moving averages at the time of publication of this technical analysis:
| RSI (14): | 47.86 | |
| MACD (12,26,9): | -1.1500 | |
| Directional Movement: | -9.04 | |
| AROON (14): | -21.43 | |
| DEMA (21): | 107.60 | |
| Parabolic SAR (0,02-0,02-0,2): | 101.97 | |
| Elder Ray (13): | -0.02 | |
| Super Trend (3,10): | 113.73 | |
| Zig ZAG (10): | 108.55 | |
| VORTEX (21): | 0.9000 | |
| Stochastique (14,3,5): | 46.05 | |
| TEMA (21): | 106.38 | |
| Williams %R (14): | -47.73 | |
| Chande Momentum Oscillator (20): | 2.94 | |
| Repulse (5,40,3): | 1.0600 | |
| ROCnROLL: | -1 | |
| TRIX (15,9): | -0.1500 | |
| Courbe Coppock: | 11.13 |
| MA7: | 108.50 | |
| MA20: | 107.99 | |
| MA50: | 107.01 | |
| MA100: | 110.35 | |
| MAexp7: | 107.90 | |
| MAexp20: | 108.99 | |
| MAexp50: | 109.38 | |
| MAexp100: | 106.92 | |
| Price / MA7: | +0.06% | |
| Price / MA20: | +0.53% | |
| Price / MA50: | +1.45% | |
| Price / MA100: | -1.62% | |
| Price / MAexp7: | +0.61% | |
| Price / MAexp20: | -0.39% | |
| Price / MAexp50: | -0.75% | |
| Price / MAexp100: | +1.53% |
News
The latest news and videos published on CAD/JPY at the time of the analysis were as follows:
-
10/10/2024 - 16:07
 CAD/JPY Forecast October 11, 2024
-
09/11/2024 - 18:19
CAD/JPY Forecast September 12, 2024
-
08/30/2024 - 16:32
CAD/JPY Forecast September 2, 2024
-
07/16/2024 - 15:28
CAD/JPY Forecast July 17, 2024
-
03/06/2023 - 16:15
CAD/JPY Forecast March 7, 2023
About author

Online


Add a comment
Comments
0 comments on the analysis CAD/JPY - Weekly