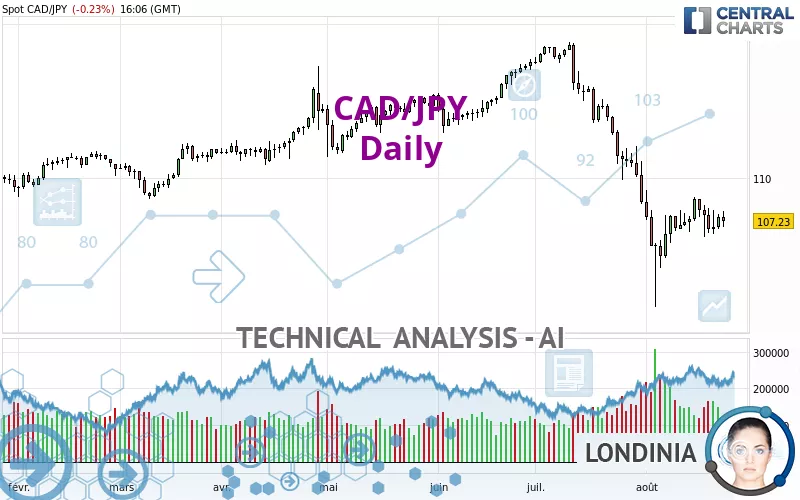
CAD/JPY - Daily - Technical analysis published on 08/23/2024 (GMT)
- 226
- 0
Click here for a new analysis!
- Timeframe : Daily
- - Analysis generated on
- Status : TARGET REACHED
Summary of the analysis

Additional analysis
Quotes
CAD/JPY rating 107.23 JPY. The price registered a decrease of -0.23% on the session and was traded between 106.86 JPY and 107.88 JPY over the period. The price is currently at +0.35% from its lowest and -0.60% from its highest.So that you have an overall view of the price change, here is a table showing the variations over several periods:
Near a new LOW record (1 year)
Type : Bearish
Timeframe : Weekly
Near a new LOW record (1st january)
Type : Bearish
Timeframe : Weekly
Near a new HIGH record (1 month)
Type : Bullish
Timeframe : Weekly
Technical
A technical analysis in Daily of this CAD/JPY chart shows a sharp bearish trend. 92.86% of the signals given by moving averages are bearish. The overall trend is supported by the strong bearish signals from short-term moving averages. An assessment of moving averages reveals a bearish signal that could impact this trend:
Bearish price crossover with adaptative moving average 20
Type : Bearish
Timeframe : Daily
The technical indicators are generally neutral. They do not provide relevant information on the direction of future price movements.
Central Indicators, the scanner specialised in technical indicators, has identified these signals:
Price is back under the pivot point
Type : Bearish
Timeframe : Daily
Price is back under the pivot point
Type : Bearish
Timeframe : Weekly
Central Patterns, the scanner specializing in chart patterns, did not identify any signals.
No result was found by the Central Candlesticks scanner on Japanese candlesticks.
| S3 | S2 | S1 | Price | R1 | R2 | R3 | |
|---|---|---|---|---|---|---|---|
| ProTrendLines | 102.41 | 104.98 | 106.25 | 107.23 | 108.88 | 109.98 | 112.09 |
| Change (%) | -4.50% | -2.10% | -0.91% | - | +1.54% | +2.56% | +4.53% |
| Change | -4.82 | -2.25 | -0.98 | - | +1.65 | +2.75 | +4.86 |
| Level | Minor | Intermediate | Major | - | Major | Major | Minor |
Pivot points can also be used to set your price objectives. Here is the price situation in relation to pivot points:
| Pivot points | S3 | S2 | S1 | PP | R1 | R2 | R3 |
|---|---|---|---|---|---|---|---|
| Standard | 105.86 | 106.28 | 106.88 | 107.30 | 107.90 | 108.32 | 108.92 |
| Camarilla | 107.20 | 107.29 | 107.39 | 107.48 | 107.57 | 107.67 | 107.76 |
| Woodie | 105.95 | 106.33 | 106.97 | 107.35 | 107.99 | 108.37 | 109.01 |
| Fibonacci | 106.28 | 106.67 | 106.91 | 107.30 | 107.69 | 107.93 | 108.32 |
| Pivot points | S3 | S2 | S1 | PP | R1 | R2 | R3 |
|---|---|---|---|---|---|---|---|
| Standard | 104.36 | 105.42 | 106.68 | 107.74 | 109.00 | 110.06 | 111.32 |
| Camarilla | 107.29 | 107.51 | 107.72 | 107.93 | 108.14 | 108.36 | 108.57 |
| Woodie | 104.45 | 105.47 | 106.77 | 107.79 | 109.09 | 110.11 | 111.41 |
| Fibonacci | 105.42 | 106.31 | 106.86 | 107.74 | 108.63 | 109.18 | 110.06 |
| Pivot points | S3 | S2 | S1 | PP | R1 | R2 | R3 |
|---|---|---|---|---|---|---|---|
| Standard | 94.42 | 101.38 | 104.93 | 111.89 | 115.44 | 122.40 | 125.95 |
| Camarilla | 105.58 | 106.54 | 107.51 | 108.47 | 109.43 | 110.40 | 111.36 |
| Woodie | 92.71 | 100.53 | 103.22 | 111.04 | 113.73 | 121.55 | 124.24 |
| Fibonacci | 101.38 | 105.40 | 107.88 | 111.89 | 115.91 | 118.39 | 122.40 |
Numerical data
The following is the status of technical indicators and moving averages registered at the time this technical analysis was created:
| RSI (14): | 39.05 | |
| MACD (12,26,9): | -1.4000 | |
| Directional Movement: | -17.07 | |
| AROON (14): | 57.14 | |
| DEMA (21): | 106.20 | |
| Parabolic SAR (0,02-0,02-0,2): | 105.41 | |
| Elder Ray (13): | -0.22 | |
| Super Trend (3,10): | 109.22 | |
| Zig ZAG (10): | 107.25 | |
| VORTEX (21): | 0.9200 | |
| Stochastique (14,3,5): | 73.33 | |
| TEMA (21): | 106.22 | |
| Williams %R (14): | -34.13 | |
| Chande Momentum Oscillator (20): | 0.85 | |
| Repulse (5,40,3): | -0.2400 | |
| ROCnROLL: | 2 | |
| TRIX (15,9): | -0.2400 | |
| Courbe Coppock: | 0.39 |
| MA7: | 107.50 | |
| MA20: | 107.41 | |
| MA50: | 112.51 | |
| MA100: | 113.07 | |
| MAexp7: | 107.30 | |
| MAexp20: | 108.27 | |
| MAexp50: | 110.72 | |
| MAexp100: | 111.76 | |
| Price / MA7: | -0.25% | |
| Price / MA20: | -0.17% | |
| Price / MA50: | -4.69% | |
| Price / MA100: | -5.16% | |
| Price / MAexp7: | -0.07% | |
| Price / MAexp20: | -0.96% | |
| Price / MAexp50: | -3.15% | |
| Price / MAexp100: | -4.05% |
News
Don't forget to follow the news on CAD/JPY. At the time of publication of this analysis, the latest news was as follows:
-
 CAD/JPY Forecast July 17, 2024
-
CAD/JPY Forecast March 7, 2023
-
CAD/JPY Forecast October 4, 2022
-
CAD/JPY Forecast September 19, 2022
-
USDJPY and CADJPY Push Reversal Risk as S&P 500 Mocks Technical Levels
About author

Online


Add a comment
Comments
0 comments on the analysis CAD/JPY - Daily