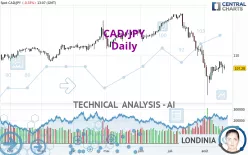
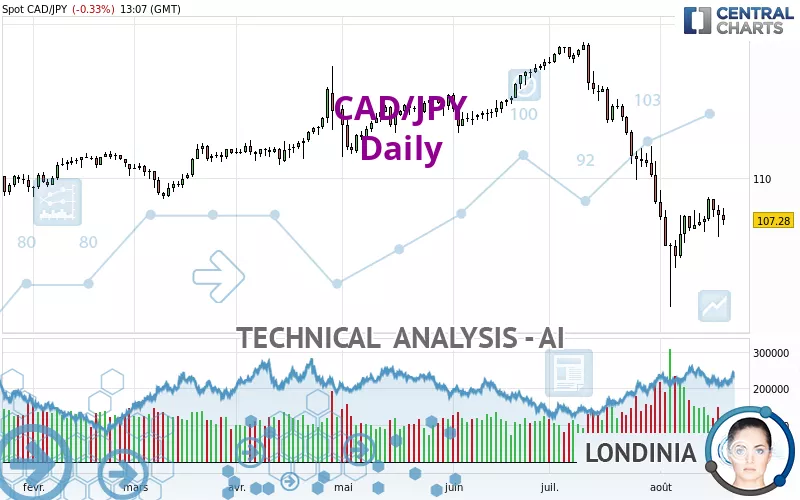
CAD/JPY - Daily - Technical analysis published on 08/20/2024 (GMT)
- 182
- 0
Click here for a new analysis!
- Timeframe : Daily
- - Analysis generated on
- Status : TARGET REACHED
Summary of the analysis

Additional analysis
Quotes
The CAD/JPY rating is 107.28 JPY. The price registered a decrease of -0.33% on the session and was traded between 107.00 JPY and 108.07 JPY over the period. The price is currently at +0.26% from its lowest and -0.73% from its highest.A study of price movements over other periods shows the following variations:
Near a new LOW record (1 year)
Type : Bearish
Timeframe : Weekly
Near a new LOW record (1st january)
Type : Bearish
Timeframe : Weekly
Near a new LOW record (1 month)
Type : Bearish
Timeframe : Weekly
Technical
A technical analysis in Daily of this CAD/JPY chart shows a sharp bearish trend. 92.86% of the signals given by moving averages are bearish. The overall trend is supported by the strong bearish signals from short-term moving averages. The Central Indicators scanner detects a bearish signal on moving averages that could impact this trend:
Bearish price crossover with adaptative moving average 20
Type : Bearish
Timeframe : Daily
The technical indicators are bullish. There is still some doubt about the price increase.
Other results related to technical indicators were also found by the Central Indicators scanner:
Price is back under the pivot point
Type : Bearish
Timeframe : Daily
Price is back under the pivot point
Type : Bearish
Timeframe : Weekly
Central Patterns, the scanner specializing in chart patterns, did not identify any signals.
No result was found by the Central Candlesticks scanner on Japanese candlesticks.
| S3 | S2 | S1 | Price | R1 | R2 | R3 | |
|---|---|---|---|---|---|---|---|
| ProTrendLines | 102.41 | 104.98 | 106.25 | 107.28 | 108.88 | 109.98 | 112.09 |
| Change (%) | -4.54% | -2.14% | -0.96% | - | +1.49% | +2.52% | +4.48% |
| Change | -4.87 | -2.30 | -1.03 | - | +1.60 | +2.70 | +4.81 |
| Level | Minor | Intermediate | Major | - | Major | Major | Minor |
To determine price objectives, it is also possible to use the pivot points. Here is the price position in relation to pivot points:
| Pivot points | S3 | S2 | S1 | PP | R1 | R2 | R3 |
|---|---|---|---|---|---|---|---|
| Standard | 104.42 | 105.32 | 106.47 | 107.37 | 108.52 | 109.42 | 110.57 |
| Camarilla | 107.07 | 107.25 | 107.44 | 107.63 | 107.82 | 108.01 | 108.19 |
| Woodie | 104.56 | 105.38 | 106.61 | 107.43 | 108.66 | 109.48 | 110.71 |
| Fibonacci | 105.32 | 106.10 | 106.58 | 107.37 | 108.15 | 108.63 | 109.42 |
| Pivot points | S3 | S2 | S1 | PP | R1 | R2 | R3 |
|---|---|---|---|---|---|---|---|
| Standard | 104.36 | 105.42 | 106.68 | 107.74 | 109.00 | 110.06 | 111.32 |
| Camarilla | 107.29 | 107.51 | 107.72 | 107.93 | 108.14 | 108.36 | 108.57 |
| Woodie | 104.45 | 105.47 | 106.77 | 107.79 | 109.09 | 110.11 | 111.41 |
| Fibonacci | 105.42 | 106.31 | 106.86 | 107.74 | 108.63 | 109.18 | 110.06 |
| Pivot points | S3 | S2 | S1 | PP | R1 | R2 | R3 |
|---|---|---|---|---|---|---|---|
| Standard | 94.42 | 101.38 | 104.93 | 111.89 | 115.44 | 122.40 | 125.95 |
| Camarilla | 105.58 | 106.54 | 107.51 | 108.47 | 109.43 | 110.40 | 111.36 |
| Woodie | 92.71 | 100.53 | 103.22 | 111.04 | 113.73 | 121.55 | 124.24 |
| Fibonacci | 101.38 | 105.40 | 107.88 | 111.89 | 115.91 | 118.39 | 122.40 |
Numerical data
The following is the status of technical indicators and moving averages registered at the time this technical analysis was created:
| RSI (14): | 37.06 | |
| MACD (12,26,9): | -1.6000 | |
| Directional Movement: | -21.32 | |
| AROON (14): | -21.43 | |
| DEMA (21): | 106.40 | |
| Parabolic SAR (0,02-0,02-0,2): | 104.44 | |
| Elder Ray (13): | -0.36 | |
| Super Trend (3,10): | 109.22 | |
| Zig ZAG (10): | 107.30 | |
| VORTEX (21): | 0.8200 | |
| Stochastique (14,3,5): | 65.84 | |
| TEMA (21): | 106.14 | |
| Williams %R (14): | -25.33 | |
| Chande Momentum Oscillator (20): | 1.69 | |
| Repulse (5,40,3): | -0.0500 | |
| ROCnROLL: | 2 | |
| TRIX (15,9): | -0.2700 | |
| Courbe Coppock: | 3.73 |
| MA7: | 107.58 | |
| MA20: | 108.05 | |
| MA50: | 112.95 | |
| MA100: | 113.21 | |
| MAexp7: | 107.55 | |
| MAexp20: | 108.70 | |
| MAexp50: | 111.19 | |
| MAexp100: | 112.05 | |
| Price / MA7: | -0.28% | |
| Price / MA20: | -0.71% | |
| Price / MA50: | -5.02% | |
| Price / MA100: | -5.24% | |
| Price / MAexp7: | -0.25% | |
| Price / MAexp20: | -1.31% | |
| Price / MAexp50: | -3.52% | |
| Price / MAexp100: | -4.26% |
News
The last news published on CAD/JPY at the time of the generation of this analysis was as follows:
-
 CAD/JPY Forecast July 17, 2024
-
CAD/JPY Forecast March 7, 2023
-
CAD/JPY Forecast October 4, 2022
-
CAD/JPY Forecast September 19, 2022
-
USDJPY and CADJPY Push Reversal Risk as S&P 500 Mocks Technical Levels
About author

Online


Add a comment
Comments
0 comments on the analysis CAD/JPY - Daily