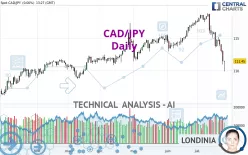
CAD/JPY - Daily - Technical analysis published on 07/25/2024 (GMT)
- 173
- 0
Click here for a new analysis!
- Timeframe : Daily
- - Analysis generated on
- Status : TARGET REACHED

Summary of the analysis

Additional analysis
Quotes
CAD/JPY rating 111.44 JPY. The price is lower by -0.01% since the last closing and was between 109.89 JPY and 111.52 JPY. This implies that the price is at +1.41% from its lowest and at -0.07% from its highest.A study of price movements over other periods shows the following variations:
Near a new HIGH record (5 years)
Type : Bullish
Timeframe : Weekly
Near a new LOW record (1st january)
Type : Bearish
Timeframe : Weekly
New LOW record (1 month)
Type : Bearish
Timeframe : Weekly
Technical
Technical analysis of CAD/JPY in Daily shows an overall bearish trend. 64.29% of the signals given by moving averages are bearish. This bearish trend is supported by the strong bearish signals given by short-term moving averages. There is no crossing of moving average by the price or crossing of moving averages between themselves.
In fact, according to the parameters integrated into the Central Analyzer system, 15 technical indicators out of 18 analysed are currently bearish. Caution: the Central Indicators scanner currently detects an excess:
RSI indicator is oversold : under 30
Type : Neutral
Timeframe : Daily
CCI indicator is oversold : under -100
Type : Neutral
Timeframe : Daily
CCI indicator: bullish divergence
Type : Bullish
Timeframe : Daily
Williams %R indicator is oversold : under -80
Type : Neutral
Timeframe : Daily
Pivot points : price is under support 3
Type : Neutral
Timeframe : Weekly
No signals are given by Central Patterns, a market scanner specialised in chart patterns, resistances and supports.
The Central Candlesticks scanner, specialised in Japanese candlesticks, did not identify any signals.
| S3 | S2 | S1 | Price | R1 | R2 | R3 | |
|---|---|---|---|---|---|---|---|
| ProTrendLines | 105.69 | 108.88 | 109.98 | 111.44 | 112.09 | 113.42 | 114.80 |
| Change (%) | -5.16% | -2.30% | -1.31% | - | +0.58% | +1.78% | +3.02% |
| Change | -5.75 | -2.56 | -1.46 | - | +0.65 | +1.98 | +3.36 |
| Level | Intermediate | Intermediate | Major | - | Intermediate | Major | Intermediate |
To determine price objectives, it is also possible to use the pivot points. Here is the price position in relation to pivot points:
| Pivot points | S3 | S2 | S1 | PP | R1 | R2 | R3 |
|---|---|---|---|---|---|---|---|
| Standard | 108.32 | 109.64 | 110.54 | 111.86 | 112.76 | 114.08 | 114.98 |
| Camarilla | 110.84 | 111.04 | 111.25 | 111.45 | 111.65 | 111.86 | 112.06 |
| Woodie | 108.12 | 109.54 | 110.34 | 111.76 | 112.56 | 113.98 | 114.78 |
| Fibonacci | 109.64 | 110.49 | 111.01 | 111.86 | 112.71 | 113.23 | 114.08 |
| Pivot points | S3 | S2 | S1 | PP | R1 | R2 | R3 |
|---|---|---|---|---|---|---|---|
| Standard | 111.00 | 112.29 | 113.49 | 114.78 | 115.98 | 117.27 | 118.47 |
| Camarilla | 114.02 | 114.24 | 114.47 | 114.70 | 114.93 | 115.16 | 115.39 |
| Woodie | 110.97 | 112.27 | 113.46 | 114.76 | 115.95 | 117.25 | 118.44 |
| Fibonacci | 112.29 | 113.24 | 113.83 | 114.78 | 115.73 | 116.32 | 117.27 |
| Pivot points | S3 | S2 | S1 | PP | R1 | R2 | R3 |
|---|---|---|---|---|---|---|---|
| Standard | 109.67 | 111.32 | 114.45 | 116.10 | 119.23 | 120.88 | 124.01 |
| Camarilla | 116.28 | 116.71 | 117.15 | 117.59 | 118.03 | 118.47 | 118.91 |
| Woodie | 110.42 | 111.69 | 115.20 | 116.47 | 119.98 | 121.25 | 124.76 |
| Fibonacci | 111.32 | 113.14 | 114.27 | 116.10 | 117.92 | 119.05 | 120.88 |
Numerical data
The following is the status of the technical indicators and moving averages at the time of publication of this technical analysis:
| RSI (14): | 26.20 | |
| MACD (12,26,9): | -0.9600 | |
| Directional Movement: | -38.69 | |
| AROON (14): | -78.57 | |
| DEMA (21): | 113.98 | |
| Parabolic SAR (0,02-0,02-0,2): | 115.90 | |
| Elder Ray (13): | -3.58 | |
| Super Trend (3,10): | 114.30 | |
| Zig ZAG (10): | 111.38 | |
| VORTEX (21): | 0.6800 | |
| Stochastique (14,3,5): | 8.34 | |
| TEMA (21): | 112.66 | |
| Williams %R (14): | -83.61 | |
| Chande Momentum Oscillator (20): | -6.99 | |
| Repulse (5,40,3): | -1.1800 | |
| ROCnROLL: | 2 | |
| TRIX (15,9): | -0.0300 | |
| Courbe Coppock: | 8.10 |
| MA7: | 113.29 | |
| MA20: | 115.99 | |
| MA50: | 115.40 | |
| MA100: | 113.78 | |
| MAexp7: | 113.16 | |
| MAexp20: | 114.88 | |
| MAexp50: | 115.01 | |
| MAexp100: | 113.96 | |
| Price / MA7: | -1.63% | |
| Price / MA20: | -3.92% | |
| Price / MA50: | -3.43% | |
| Price / MA100: | -2.06% | |
| Price / MAexp7: | -1.52% | |
| Price / MAexp20: | -2.99% | |
| Price / MAexp50: | -3.10% | |
| Price / MAexp100: | -2.21% |
News
The last news published on CAD/JPY at the time of the generation of this analysis was as follows:
-
 CAD/JPY Forecast July 17, 2024
-
CAD/JPY Forecast March 7, 2023
-
CAD/JPY Forecast October 4, 2022
-
CAD/JPY Forecast September 19, 2022
-
USDJPY and CADJPY Push Reversal Risk as S&P 500 Mocks Technical Levels
About author

Online


Add a comment
Comments
0 comments on the analysis CAD/JPY - Daily