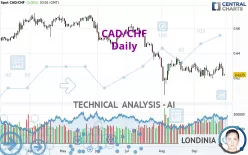
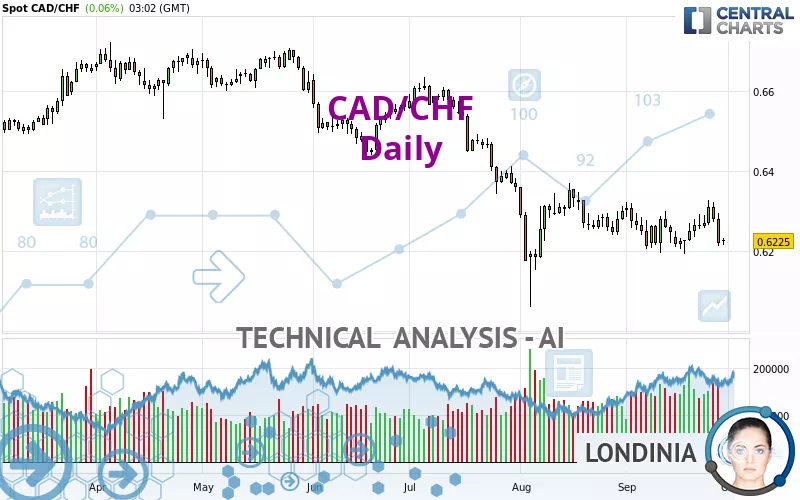
CAD/CHF - Daily - Technical analysis published on 09/30/2024 (GMT)
- 331
- 0
Click here for a new analysis!
- Timeframe : Daily
- - Analysis generated on
- Status : LEVEL MAINTAINED
Summary of the analysis

Additional analysis
Quotes
The CAD/CHF price is 0.6225 CHF. The price registered an increase of +0.06% on the session with the lowest point at 0.6216 CHF and the highest point at 0.6233 CHF. The deviation from the price is +0.14% for the low point and -0.13% for the high point.The Central Gaps scanner detects a bullish opening marking the presence of buyers ahead of sellers at the opening but not sufficiently marked to allow the price to register a quotation gap.
Bullish opening
Type : Bullish
Timeframe : Openning
A study of price movements over other periods shows the following variations:
Near a new LOW record (5 years)
Type : Bearish
Timeframe : Weekly
Near a new LOW record (1 year)
Type : Bearish
Timeframe : Weekly
Near a new LOW record (1st january)
Type : Bearish
Timeframe : Weekly
Near a new HIGH record (1 month)
Type : Bullish
Timeframe : Weekly
Technical
A technical analysis in Daily of this CAD/CHF chart shows a sharp bearish trend. 92.86% of the signals given by moving averages are bearish. The overall trend is supported by the strong bearish signals from short-term moving averages. The Central Indicators market scanner currently does not detect any result that concerns moving averages.
In fact, only 9 technical indicators out of 18 studied are currently positioned bearish. No additional result has been identified by Central Indicators, the scanner specialised in technical indicators.
The Central Patterns scanner, which studies chart patterns, resistances and supports, has identified this signal:
Near support of channel
Type : Bullish
Timeframe : Daily
Central Candlesticks, the scanner specialised in Japanese candlesticks, detects a bullish signal that could support the hypothesis of a small rebound in the very short term:
Bullish harami cross
Type : Bullish
Timeframe : Daily
| S1 | Price | R1 | R2 | R3 | |
|---|---|---|---|---|---|
| ProTrendLines | 0.6176 | 0.6225 | 0.6352 | 0.6482 | 0.6613 |
| Change (%) | -0.79% | - | +2.04% | +4.13% | +6.23% |
| Change | -0.0049 | - | +0.0127 | +0.0257 | +0.0388 |
| Level | Major | - | Intermediate | Major | Minor |
Pivot points can also be used to set your price objectives. Here is the price situation in relation to pivot points:
| Pivot points | S3 | S2 | S1 | PP | R1 | R2 | R3 |
|---|---|---|---|---|---|---|---|
| Standard | 0.6109 | 0.6161 | 0.6191 | 0.6243 | 0.6273 | 0.6325 | 0.6355 |
| Camarilla | 0.6199 | 0.6206 | 0.6214 | 0.6221 | 0.6229 | 0.6236 | 0.6244 |
| Woodie | 0.6098 | 0.6156 | 0.6180 | 0.6238 | 0.6262 | 0.6320 | 0.6344 |
| Fibonacci | 0.6161 | 0.6192 | 0.6212 | 0.6243 | 0.6274 | 0.6294 | 0.6325 |
| Pivot points | S3 | S2 | S1 | PP | R1 | R2 | R3 |
|---|---|---|---|---|---|---|---|
| Standard | 0.6066 | 0.6140 | 0.6180 | 0.6254 | 0.6294 | 0.6368 | 0.6408 |
| Camarilla | 0.6190 | 0.6200 | 0.6211 | 0.6221 | 0.6232 | 0.6242 | 0.6252 |
| Woodie | 0.6050 | 0.6132 | 0.6164 | 0.6246 | 0.6278 | 0.6360 | 0.6392 |
| Fibonacci | 0.6140 | 0.6183 | 0.6210 | 0.6254 | 0.6297 | 0.6324 | 0.6368 |
| Pivot points | S3 | S2 | S1 | PP | R1 | R2 | R3 |
|---|---|---|---|---|---|---|---|
| Standard | 0.5805 | 0.5932 | 0.6116 | 0.6243 | 0.6427 | 0.6554 | 0.6738 |
| Camarilla | 0.6214 | 0.6242 | 0.6271 | 0.6299 | 0.6328 | 0.6356 | 0.6385 |
| Woodie | 0.5833 | 0.5946 | 0.6144 | 0.6257 | 0.6455 | 0.6568 | 0.6766 |
| Fibonacci | 0.5932 | 0.6051 | 0.6125 | 0.6243 | 0.6362 | 0.6436 | 0.6554 |
Numerical data
The following is the status of technical indicators and moving averages registered at the time this technical analysis was created:
| RSI (14): | 42.93 | |
| MACD (12,26,9): | -0.0012 | |
| Directional Movement: | -4.5869 | |
| AROON (14): | 35.7143 | |
| DEMA (21): | 0.6239 | |
| Parabolic SAR (0,02-0,02-0,2): | 0.6325 | |
| Elder Ray (13): | -0.0030 | |
| Super Trend (3,10): | 0.6166 | |
| Zig ZAG (10): | 0.6223 | |
| VORTEX (21): | 0.9393 | |
| Stochastique (14,3,5): | 36.79 | |
| TEMA (21): | 0.6254 | |
| Williams %R (14): | -76.30 | |
| Chande Momentum Oscillator (20): | -0.0038 | |
| Repulse (5,40,3): | -1.0046 | |
| ROCnROLL: | 2 | |
| TRIX (15,9): | -0.0324 | |
| Courbe Coppock: | 0.09 |
| MA7: | 0.6262 | |
| MA20: | 0.6251 | |
| MA50: | 0.6283 | |
| MA100: | 0.6426 | |
| MAexp7: | 0.6250 | |
| MAexp20: | 0.6259 | |
| MAexp50: | 0.6307 | |
| MAexp100: | 0.6381 | |
| Price / MA7: | -0.59% | |
| Price / MA20: | -0.42% | |
| Price / MA50: | -0.92% | |
| Price / MA100: | -3.13% | |
| Price / MAexp7: | -0.40% | |
| Price / MAexp20: | -0.54% | |
| Price / MAexp50: | -1.30% | |
| Price / MAexp100: | -2.44% |
News
The last news published on CAD/CHF at the time of the generation of this analysis was as follows:
-
 CAD/CHF Forecast August 27, 2024
-
CAD/CHF Forecast July 26, 2024
-
CAD/CHF Forecast May 31, 2024
-
CAD/CHF Finds the Proper Blend of Fuel and Clearance for Reversal
About author

Online


Add a comment
Comments
0 comments on the analysis CAD/CHF - Daily