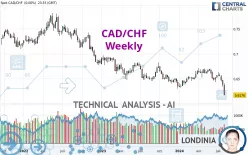
CAD/CHF - Weekly - Technical analysis published on 08/04/2024 (GMT)
- 638
- 0
Click here for a new analysis!
- Timeframe : Weekly
- - Analysis generated on
- Status : LEVEL MAINTAINED

Summary of the analysis

Additional analysis
Quotes
The CAD/CHF rating is 0.6177 CHF. The price registered a decrease of -3.29% over 5 days and has been traded over the last 5 days between 0.6175 CHF and 0.6382 CHF. This implies that the 5 day price is +0.03% from its lowest point and -3.21% from its highest point.A bullish opening was detected by the Central Gaps scanner. Buyers are trying to impose a bullish momentum in the very short term.
Bullish opening
Type : Bullish
Timeframe : Openning
A study of price movements over other periods shows the following variations:
Near a new LOW record (5 years)
Type : Bearish
Timeframe : Weekly
Near a new LOW record (1 year)
Type : Bearish
Timeframe : Weekly
Near a new LOW record (1st january)
Type : Bearish
Timeframe : Weekly
Near a new LOW record (1 month)
Type : Bearish
Timeframe : Weekly
Technical
Technical analysis of this Weekly chart of CAD/CHF indicates that the overall trend is strongly bearish. 89.29% of the signals given by moving averages are bearish. The overall trend is supported by the strong bearish signals from short-term moving averages. The Central Indicators market scanner is currently detecting a bearish signal that could impact this trend:
Moving Average bearish crossovers : AMA20 & AMA50
Type : Bearish
Timeframe : Weekly
In fact, 13 technical indicators on 18 studied are currently positioned bearish. Caution: the Central Indicators scanner currently detects an excess:
RSI indicator is oversold : under 30
Type : Neutral
Timeframe : Weekly
CCI indicator is oversold : under -100
Type : Neutral
Timeframe : Weekly
Previous candle closed under Bollinger bands
Type : Neutral
Timeframe : Weekly
Williams %R indicator is oversold : under -80
Type : Neutral
Timeframe : Weekly
The Central Patterns scanner, which studies chart patterns, resistances and supports, has identified these signals:
Near horizontal resistance
Type : Bearish
Timeframe : Weekly
Near support of channel
Type : Bullish
Timeframe : Weekly
The presence of these bullish Japanese candlestick patterns detected by Central Candlesticks that could cause a very short term rebound were also noted:
Bullish harami
Type : Bullish
Timeframe : Weekly
Bullish harami cross
Type : Bullish
Timeframe : Weekly
| Price | R1 | R2 | R3 | |
|---|---|---|---|---|
| ProTrendLines | 0.6177 | 0.6352 | 0.6482 | 0.6818 |
| Change (%) | - | +2.83% | +4.94% | +10.38% |
| Change | - | +0.0175 | +0.0305 | +0.0641 |
| Level | - | Major | Intermediate | Intermediate |
To determine price objectives, it is also possible to use the pivot points. Here is the price position in relation to pivot points:
| Pivot points | S3 | S2 | S1 | PP | R1 | R2 | R3 |
|---|---|---|---|---|---|---|---|
| Standard | 0.6012 | 0.6093 | 0.6135 | 0.6216 | 0.6258 | 0.6339 | 0.6381 |
| Camarilla | 0.6142 | 0.6154 | 0.6165 | 0.6176 | 0.6187 | 0.6199 | 0.6210 |
| Woodie | 0.5992 | 0.6083 | 0.6115 | 0.6206 | 0.6238 | 0.6329 | 0.6361 |
| Fibonacci | 0.6093 | 0.6140 | 0.6169 | 0.6216 | 0.6263 | 0.6292 | 0.6339 |
| Pivot points | S3 | S2 | S1 | PP | R1 | R2 | R3 |
|---|---|---|---|---|---|---|---|
| Standard | 0.5861 | 0.6018 | 0.6097 | 0.6254 | 0.6333 | 0.6490 | 0.6569 |
| Camarilla | 0.6111 | 0.6133 | 0.6154 | 0.6176 | 0.6198 | 0.6219 | 0.6241 |
| Woodie | 0.5822 | 0.5999 | 0.6058 | 0.6235 | 0.6294 | 0.6471 | 0.6530 |
| Fibonacci | 0.6018 | 0.6108 | 0.6164 | 0.6254 | 0.6344 | 0.6400 | 0.6490 |
| Pivot points | S3 | S2 | S1 | PP | R1 | R2 | R3 |
|---|---|---|---|---|---|---|---|
| Standard | 0.5965 | 0.6153 | 0.6257 | 0.6445 | 0.6549 | 0.6737 | 0.6841 |
| Camarilla | 0.6280 | 0.6307 | 0.6333 | 0.6360 | 0.6387 | 0.6414 | 0.6440 |
| Woodie | 0.5922 | 0.6132 | 0.6214 | 0.6424 | 0.6506 | 0.6716 | 0.6798 |
| Fibonacci | 0.6153 | 0.6265 | 0.6334 | 0.6445 | 0.6557 | 0.6626 | 0.6737 |
Numerical data
The following are the details of the technical indicators and moving averages that were collected to generate this technical analysis:
| RSI (14): | 27.98 | |
| MACD (12,26,9): | -0.0065 | |
| Directional Movement: | -24.4673 | |
| AROON (14): | -64.2857 | |
| DEMA (21): | 0.6416 | |
| Parabolic SAR (0,02-0,02-0,2): | 0.6568 | |
| Elder Ray (13): | -0.0253 | |
| Super Trend (3,10): | 0.6483 | |
| Zig ZAG (10): | 0.6191 | |
| VORTEX (21): | 0.8431 | |
| Stochastique (14,3,5): | 5.19 | |
| TEMA (21): | 0.6361 | |
| Williams %R (14): | -96.99 | |
| Chande Momentum Oscillator (20): | -0.0489 | |
| Repulse (5,40,3): | -4.2244 | |
| ROCnROLL: | 2 | |
| TRIX (15,9): | -0.0250 | |
| Courbe Coppock: | 7.47 |
| MA7: | 0.6309 | |
| MA20: | 0.6434 | |
| MA50: | 0.6503 | |
| MA100: | 0.6576 | |
| MAexp7: | 0.6364 | |
| MAexp20: | 0.6479 | |
| MAexp50: | 0.6555 | |
| MAexp100: | 0.6691 | |
| Price / MA7: | -2.09% | |
| Price / MA20: | -3.99% | |
| Price / MA50: | -5.01% | |
| Price / MA100: | -6.07% | |
| Price / MAexp7: | -2.94% | |
| Price / MAexp20: | -4.66% | |
| Price / MAexp50: | -5.77% | |
| Price / MAexp100: | -7.68% |
News
The last news published on CAD/CHF at the time of the generation of this analysis was as follows:
-
 CAD/CHF Forecast July 26, 2024
-
CAD/CHF Forecast May 31, 2024
-
CAD/CHF Finds the Proper Blend of Fuel and Clearance for Reversal
About author

Online


Add a comment
Comments
0 comments on the analysis CAD/CHF - Weekly