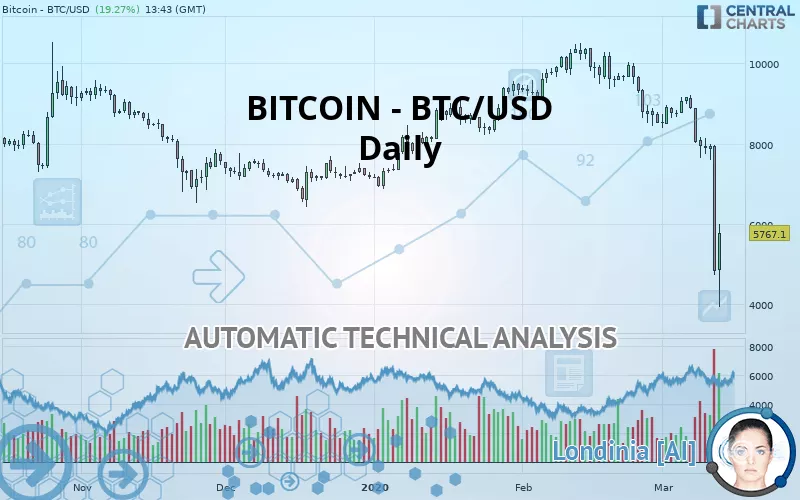
BITCOIN - BTC/USD - Daily - Technical analysis published on 03/13/2020 (GMT)
- 296
- 0
- Who voted?
Click here for a new analysis!
- Timeframe : Daily
- - Analysis generated on
- Status : TARGET REACHED
Summary of the analysis

Additional analysis
Quotes
The BITCOIN - BTC/USD rating is 5,767.10 USD. The price is lower by +19.27% since the last closing with the lowest point at 3,926.30 USD and the highest point at 5,999.00 USD. The deviation from the price is +46.88% for the low point and -3.87% for the high point.The Central Gaps scanner detects a bullish opening. A small advantage for buyers in the very short term.
Bullish opening
Type : Bullish
Timeframe : Openning
Here is a more detailed summary of the historical variations registered by BITCOIN - BTC/USD:
New LOW record (1 year)
Type : Bearish
Timeframe : Weekly
New LOW record (1st january)
Type : Bearish
Timeframe : Weekly
New LOW record (1 month)
Type : Bearish
Timeframe : Weekly
Technical
Technical analysis of this Daily chart of BITCOIN - BTC/USD indicates that the overall trend is strongly bearish. 85.71% of the signals given by moving averages are bearish. The overall trend is supported by the strong bearish signals from short-term moving averages. An assessment of moving averages reveals a bearish signal that could impact this trend:
Bearish trend reversal : Moving Average 100
Type : Bearish
Timeframe : Daily
In fact, according to the parameters integrated into the Central Analyzer system, 12 technical indicators out of 18 analysed are currently bearish. Caution: the Central Indicators scanner currently detects an excess:
RSI indicator is oversold : under 20
Type : Neutral
Timeframe : Daily
CCI indicator is oversold : under -100
Type : Neutral
Timeframe : Daily
Williams %R indicator is oversold : under -80
Type : Neutral
Timeframe : Daily
Pivot points : price is under support 3
Type : Neutral
Timeframe : Weekly
Price is back over the pivot point
Type : Bullish
Timeframe : Weekly
Price is back under the pivot point
Type : Bearish
Timeframe : Daily
The Central Patterns scanner, which studies chart patterns, resistances and supports, has identified these signals:
Horizontal support is broken
Type : Bearish
Timeframe : Daily
Support of channel is broken
Type : Bearish
Timeframe : Daily
Central Candlesticks, the scanner specialised in Japanese candlesticks, detects these bearish signals that could support the hypothesis of a small drop in the very short term:
Black marubozu
Type : Bearish
Timeframe : Daily
Long black line
Type : Bearish
Timeframe : Daily
| S2 | S1 | Price | R1 | R2 | R3 | |
|---|---|---|---|---|---|---|
| ProTrendLines | 1,237.55 | 3,182.14 | 5,767.10 | 5,875.21 | 6,615.23 | 6,924.53 |
| Change (%) | -78.54% | -44.82% | - | +1.87% | +14.71% | +20.07% |
| Change | -4,529.55 | -2,584.96 | - | +108.11 | +848.13 | +1,157.43 |
| Level | Minor | Major | - | Major | Minor | Intermediate |
Pivot points can also be used to set your price objectives. Here is the price situation in relation to pivot points:
| Pivot points | S3 | S2 | S1 | PP | R1 | R2 | R3 |
|---|---|---|---|---|---|---|---|
| Standard | 459.40 | 2,587.40 | 3,711.30 | 5,839.30 | 6,963.20 | 9,091.20 | 10,215.10 |
| Camarilla | 3,940.93 | 4,239.02 | 4,537.11 | 4,835.20 | 5,133.29 | 5,431.38 | 5,729.47 |
| Woodie | -42.65 | 2,336.38 | 3,209.25 | 5,588.28 | 6,461.15 | 8,840.18 | 9,713.05 |
| Fibonacci | 2,587.40 | 3,829.63 | 4,597.07 | 5,839.30 | 7,081.53 | 7,848.97 | 9,091.20 |
| Pivot points | S3 | S2 | S1 | PP | R1 | R2 | R3 |
|---|---|---|---|---|---|---|---|
| Standard | 7,654.08 | 8,028.55 | 8,464.07 | 8,838.54 | 9,274.06 | 9,648.53 | 10,084.05 |
| Camarilla | 8,676.85 | 8,751.10 | 8,825.35 | 8,899.60 | 8,973.85 | 9,048.10 | 9,122.35 |
| Woodie | 7,684.61 | 8,043.81 | 8,494.61 | 8,853.80 | 9,304.60 | 9,663.79 | 10,114.59 |
| Fibonacci | 8,028.55 | 8,337.96 | 8,529.12 | 8,838.54 | 9,147.95 | 9,339.11 | 9,648.53 |
| Pivot points | S3 | S2 | S1 | PP | R1 | R2 | R3 |
|---|---|---|---|---|---|---|---|
| Standard | 5,742.50 | 7,090.90 | 7,809.00 | 9,157.40 | 9,875.50 | 11,223.90 | 11,942.00 |
| Camarilla | 7,958.81 | 8,148.24 | 8,337.67 | 8,527.10 | 8,716.53 | 8,905.96 | 9,095.39 |
| Woodie | 5,427.35 | 6,933.33 | 7,493.85 | 8,999.83 | 9,560.35 | 11,066.33 | 11,626.85 |
| Fibonacci | 7,090.90 | 7,880.30 | 8,368.00 | 9,157.40 | 9,946.80 | 10,434.50 | 11,223.90 |
Numerical data
The following are the details of the technical indicators and moving averages that were collected to generate this technical analysis:
| RSI (14): | 29.99 | |
| MACD (12,26,9): | -736.0600 | |
| Directional Movement: | -45.17 | |
| AROON (14): | -42.86 | |
| DEMA (21): | 7,322.26 | |
| Parabolic SAR (0,02-0,02-0,2): | 8,657.02 | |
| Elder Ray (13): | -2,738.44 | |
| Super Trend (3,10): | 7,494.02 | |
| Zig ZAG (10): | 5,843.10 | |
| VORTEX (21): | 0.5700 | |
| Stochastique (14,3,5): | 19.73 | |
| TEMA (21): | 6,632.55 | |
| Williams %R (14): | -65.29 | |
| Chande Momentum Oscillator (20): | -2,757.90 | |
| Repulse (5,40,3): | -25.5600 | |
| ROCnROLL: | 2 | |
| TRIX (15,9): | -0.6300 | |
| Courbe Coppock: | 40.64 |
| MA7: | 7,337.02 | |
| MA20: | 8,424.91 | |
| MA50: | 9,117.86 | |
| MA100: | 8,390.52 | |
| MAexp7: | 7,013.81 | |
| MAexp20: | 8,138.76 | |
| MAexp50: | 8,650.26 | |
| MAexp100: | 8,665.33 | |
| Price / MA7: | -21.40% | |
| Price / MA20: | -31.55% | |
| Price / MA50: | -36.75% | |
| Price / MA100: | -31.27% | |
| Price / MAexp7: | -17.78% | |
| Price / MAexp20: | -29.14% | |
| Price / MAexp50: | -33.33% | |
| Price / MAexp100: | -33.45% |
About author

Online


Add a comment
Comments
0 comments on the analysis BITCOIN - BTC/USD - Daily