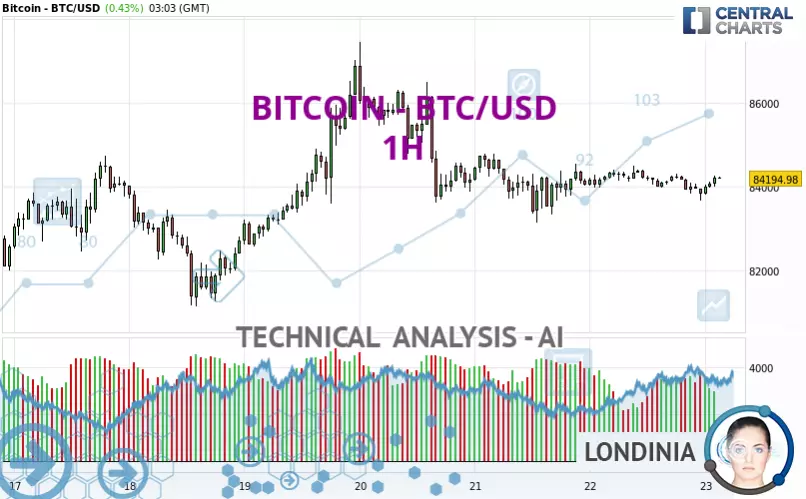
BITCOIN - BTC/USD - 1H - Technical analysis published on 03/23/2025 (GMT)
- 237
- 0
- Who voted?
- Timeframe : 1H
- - Analysis generated on
- Status : NEUTRAL

Summary of the analysis

Additional analysis
Quotes
The BITCOIN - BTC/USD rating is 84,195.51 USD. The price registered an increase of +0.43% on the session and was between 83,800.16 USD and 84,263.73 USD. This implies that the price is at +0.47% from its lowest and at -0.08% from its highest.A bullish opening was detected by the Central Gaps scanner. Buyers are trying to impose a bullish momentum in the very short term.
Bullish opening
Type : Bullish
Timeframe : Openning
Here is a more detailed summary of the historical variations registered by BITCOIN - BTC/USD:
Technical
A technical analysis in 1H of this BITCOIN - BTC/USD chart shows a slightly bearish trend. 53.57% of the signals given by moving averages are bearish. Caution: the slightly bullish signals currently given by short-term moving averages could cause a reversal of the trend. The Central Indicators market scanner is currently detecting several bullish signals that could impact this trend:
Bullish trend reversal : adaptative moving average 20
Type : Bullish
Timeframe : 1 hour
Bullish trend reversal : adaptative moving average 50
Type : Bullish
Timeframe : 1 hour
Bullish trend reversal : adaptative moving average 100
Type : Bullish
Timeframe : 1 hour
In fact, 11 technical indicators on 18 studied are currently positioned bullish. The Central Indicators scanner found this result concerning these indicators:
Momentum indicator is back over 0
Type : Bullish
Timeframe : 1 hour
Central Patterns, the scanner specializing in chart patterns, did not identify any signals.
Central Candlesticks, the scanner specialised in Japanese candlesticks, detects a bearish signal that could support the hypothesis of a small drop in the very short term:
Bearish engulfing lines
Type : Bearish
Timeframe : 1 hour
| S3 | S2 | S1 | Price | R1 | R2 | R3 | |
|---|---|---|---|---|---|---|---|
| ProTrendLines | 81,140.42 | 81,997.48 | 83,622.38 | 84,195.51 | 84,275.89 | 84,765.96 | 85,300.96 |
| Change (%) | -3.63% | -2.61% | -0.68% | - | +0.10% | +0.68% | +1.31% |
| Change | -3,055.09 | -2,198.03 | -573.13 | - | +80.38 | +570.45 | +1,105.45 |
| Level | Intermediate | Intermediate | Intermediate | - | Intermediate | Major | Minor |
Pivot points can also be used to set your price objectives. Here is the price situation in relation to pivot points:
| Pivot points | S3 | S2 | S1 | PP | R1 | R2 | R3 |
|---|---|---|---|---|---|---|---|
| Standard | 82,672.87 | 83,171.29 | 83,503.87 | 84,002.29 | 84,334.87 | 84,833.29 | 85,165.87 |
| Camarilla | 83,607.93 | 83,684.10 | 83,760.28 | 83,836.45 | 83,912.63 | 83,988.80 | 84,064.98 |
| Woodie | 82,589.95 | 83,129.83 | 83,420.95 | 83,960.83 | 84,251.95 | 84,791.83 | 85,082.95 |
| Fibonacci | 83,171.29 | 83,488.73 | 83,684.85 | 84,002.29 | 84,319.73 | 84,515.85 | 84,833.29 |
| Pivot points | S3 | S2 | S1 | PP | R1 | R2 | R3 |
|---|---|---|---|---|---|---|---|
| Standard | 74,512.03 | 77,826.22 | 80,831.34 | 84,145.53 | 87,150.65 | 90,464.84 | 93,469.96 |
| Camarilla | 82,098.64 | 82,677.91 | 83,257.18 | 83,836.45 | 84,415.72 | 84,994.99 | 85,574.26 |
| Woodie | 74,357.49 | 77,748.95 | 80,676.80 | 84,068.26 | 86,996.11 | 90,387.57 | 93,315.42 |
| Fibonacci | 77,826.22 | 80,240.20 | 81,731.56 | 84,145.53 | 86,559.51 | 88,050.87 | 90,464.84 |
| Pivot points | S3 | S2 | S1 | PP | R1 | R2 | R3 |
|---|---|---|---|---|---|---|---|
| Standard | 49,862.18 | 64,044.37 | 74,184.92 | 88,367.11 | 98,507.66 | 112,689.85 | 122,830.40 |
| Camarilla | 77,636.72 | 79,866.30 | 82,095.89 | 84,325.47 | 86,555.06 | 88,784.64 | 91,014.22 |
| Woodie | 47,841.36 | 63,033.96 | 72,164.10 | 87,356.70 | 96,486.84 | 111,679.44 | 120,809.58 |
| Fibonacci | 64,044.37 | 73,335.66 | 79,075.82 | 88,367.11 | 97,658.40 | 103,398.56 | 112,689.85 |
Numerical data
The following is the status of the technical indicators and moving averages at the time of publication of this technical analysis:
| RSI (14): | 48.53 | |
| MACD (12,26,9): | -55.2700 | |
| Directional Movement: | -9.85 | |
| AROON (14): | -35.71 | |
| DEMA (21): | 84,020.85 | |
| Parabolic SAR (0,02-0,02-0,2): | 84,343.61 | |
| Elder Ray (13): | 9.97 | |
| Super Trend (3,10): | 84,430.82 | |
| Zig ZAG (10): | 84,067.06 | |
| VORTEX (21): | 0.9500 | |
| Stochastique (14,3,5): | 54.69 | |
| TEMA (21): | 84,006.11 | |
| Williams %R (14): | -42.82 | |
| Chande Momentum Oscillator (20): | 28.81 | |
| Repulse (5,40,3): | 0.0400 | |
| ROCnROLL: | 2 | |
| TRIX (15,9): | -0.0100 | |
| Courbe Coppock: | 0.51 |
| MA7: | 84,247.27 | |
| MA20: | 84,421.44 | |
| MA50: | 90,442.62 | |
| MA100: | 94,858.99 | |
| MAexp7: | 84,024.12 | |
| MAexp20: | 84,090.65 | |
| MAexp50: | 84,177.87 | |
| MAexp100: | 84,127.44 | |
| Price / MA7: | -0.06% | |
| Price / MA20: | -0.27% | |
| Price / MA50: | -6.91% | |
| Price / MA100: | -11.24% | |
| Price / MAexp7: | +0.20% | |
| Price / MAexp20: | +0.12% | |
| Price / MAexp50: | +0.02% | |
| Price / MAexp100: | +0.08% |
About author

Online


Add a comment
Comments
0 comments on the analysis BITCOIN - BTC/USD - 1H