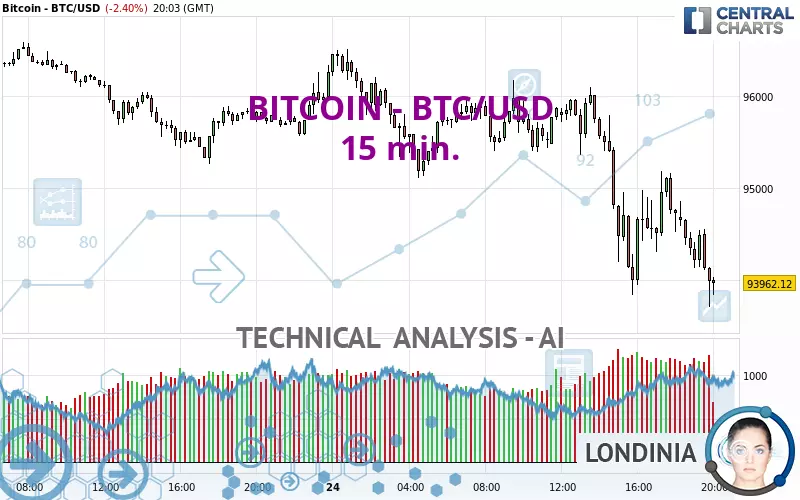
BITCOIN - BTC/USD - 15 min. - Technical analysis published on 02/24/2025 (GMT)
- 120
- 0
Click here for a new analysis!
- Timeframe : 15 min.
- - Analysis generated on
- Status : TARGET REACHED

Summary of the analysis

Additional analysis
Quotes
The BITCOIN - BTC/USD rating is 93,962.12 USD. The price registered a decrease of -2.40% on the session and was between 93,703.84 USD and 96,511.09 USD. This implies that the price is at +0.28% from its lowest and at -2.64% from its highest.The Central Gaps scanner detects a bullish opening marking the presence of buyers ahead of sellers at the opening but not sufficiently marked to allow the price to register a quotation gap.
Bullish opening
Type : Bullish
Timeframe : Openning
So that you have an overall view of the price change, here is a table showing the variations over several periods:
Near a new LOW record (1st january)
Type : Bearish
Timeframe : Weekly
Near a new LOW record (1 month)
Type : Bearish
Timeframe : Weekly
Technical
A technical analysis in 15 min. of this BITCOIN - BTC/USD chart shows a sharp bearish trend. 92.86% of the signals given by moving averages are bearish. The overall trend is supported by the strong bearish signals from short-term moving averages. The Central Indicators market scanner currently does not detect any result that concerns moving averages.
The probability of a further decline is moderate given the direction of the technical indicators.
Caution: the Central Indicators scanner currently detects an excess:
CCI indicator is oversold : under -100
Type : Neutral
Timeframe : 15 minutes
CCI indicator: bullish divergence
Type : Bullish
Timeframe : 15 minutes
RSI indicator: bullish divergence
Type : Bullish
Timeframe : 15 minutes
Williams %R indicator is oversold : under -80
Type : Neutral
Timeframe : 15 minutes
Pivot points : price is under support 3
Type : Neutral
Timeframe : 15 minutes
MACD crosses UP its Moving Average
Type : Bullish
Timeframe : 15 minutes
Price is back under the pivot point
Type : Bearish
Timeframe : Weekly
Central Patterns, the scanner specializing in chart patterns, did not identify any signals.
From the Japanese candlestick perspective, the Central Candlesticks scanner notes the presence of these results that could impact the short-term trend:
Bearish harami
Type : Bearish
Timeframe : 15 minutes
Doji
Type : Neutral
Timeframe : 15 minutes
| S3 | S2 | S1 | Price | R1 | R2 | R3 | |
|---|---|---|---|---|---|---|---|
| ProTrendLines | 67,552.80 | 92,549.70 | 93,364.36 | 93,962.12 | 94,799.63 | 95,867.20 | 96,706.12 |
| Change (%) | -28.11% | -1.50% | -0.64% | - | +0.89% | +2.03% | +2.92% |
| Change | -26,409.32 | -1,412.42 | -597.76 | - | +837.51 | +1,905.08 | +2,744.00 |
| Level | Major | Intermediate | Intermediate | - | Intermediate | Minor | Intermediate |
To determine price objectives, it is also possible to use the pivot points. Here is the price position in relation to pivot points:
| Pivot points | S3 | S2 | S1 | PP | R1 | R2 | R3 |
|---|---|---|---|---|---|---|---|
| Standard | 94,052.19 | 94,656.50 | 95,465.32 | 96,069.63 | 96,878.45 | 97,482.76 | 98,291.58 |
| Camarilla | 95,885.53 | 96,015.07 | 96,144.60 | 96,274.14 | 96,403.68 | 96,533.21 | 96,662.75 |
| Woodie | 94,154.45 | 94,707.63 | 95,567.58 | 96,120.76 | 96,980.71 | 97,533.89 | 98,393.84 |
| Fibonacci | 94,656.50 | 95,196.32 | 95,529.81 | 96,069.63 | 96,609.45 | 96,942.94 | 97,482.76 |
| Pivot points | S3 | S2 | S1 | PP | R1 | R2 | R3 |
|---|---|---|---|---|---|---|---|
| Standard | 87,312.39 | 90,338.38 | 93,458.68 | 96,484.67 | 99,604.97 | 102,630.96 | 105,751.26 |
| Camarilla | 94,888.76 | 95,452.17 | 96,015.58 | 96,578.99 | 97,142.40 | 97,705.81 | 98,269.22 |
| Woodie | 87,359.56 | 90,361.96 | 93,505.85 | 96,508.25 | 99,652.14 | 102,654.54 | 105,798.43 |
| Fibonacci | 90,338.38 | 92,686.26 | 94,136.78 | 96,484.67 | 98,832.55 | 100,283.07 | 102,630.96 |
| Pivot points | S3 | S2 | S1 | PP | R1 | R2 | R3 |
|---|---|---|---|---|---|---|---|
| Standard | 71,450.13 | 80,340.46 | 91,374.33 | 100,264.66 | 111,298.53 | 120,188.86 | 131,222.73 |
| Camarilla | 96,929.06 | 98,755.44 | 100,581.83 | 102,408.21 | 104,234.60 | 106,060.98 | 107,887.37 |
| Woodie | 72,521.91 | 80,876.35 | 92,446.11 | 100,800.55 | 112,370.31 | 120,724.75 | 132,294.51 |
| Fibonacci | 80,340.46 | 87,951.50 | 92,653.61 | 100,264.66 | 107,875.70 | 112,577.81 | 120,188.86 |
Numerical data
The following is the status of technical indicators and moving averages registered at the time this technical analysis was created:
| RSI (14): | 40.17 | |
| MACD (12,26,9): | -266.0900 | |
| Directional Movement: | -13.65 | |
| AROON (14): | 42.86 | |
| DEMA (21): | 94,356.27 | |
| Parabolic SAR (0,02-0,02-0,2): | 94,008.91 | |
| Elder Ray (13): | -290.55 | |
| Super Trend (3,10): | 95,305.31 | |
| Zig ZAG (10): | 94,379.96 | |
| VORTEX (21): | 0.8800 | |
| Stochastique (14,3,5): | 28.18 | |
| TEMA (21): | 94,259.67 | |
| Williams %R (14): | -84.44 | |
| Chande Momentum Oscillator (20): | -485.15 | |
| Repulse (5,40,3): | -0.1800 | |
| ROCnROLL: | 2 | |
| TRIX (15,9): | -0.0400 | |
| Courbe Coppock: | 0.35 |
| MA7: | 96,285.62 | |
| MA20: | 96,563.67 | |
| MA50: | 98,860.09 | |
| MA100: | 98,055.58 | |
| MAexp7: | 94,449.83 | |
| MAexp20: | 94,727.06 | |
| MAexp50: | 95,129.73 | |
| MAexp100: | 95,442.89 | |
| Price / MA7: | -2.41% | |
| Price / MA20: | -2.69% | |
| Price / MA50: | -4.95% | |
| Price / MA100: | -4.17% | |
| Price / MAexp7: | -0.52% | |
| Price / MAexp20: | -0.81% | |
| Price / MAexp50: | -1.23% | |
| Price / MAexp100: | -1.55% |
About author

Online


Add a comment
Comments
0 comments on the analysis BITCOIN - BTC/USD - 15 min.