BITCOIN - BTC/USD - 15 min. - Technical analysis published on 02/16/2025 (GMT)
- 467
- 0
Click here for a new analysis!
- Timeframe : 15 min.
- - Analysis generated on
- Status : LEVEL MAINTAINED
Summary of the analysis

Additional analysis
Quotes
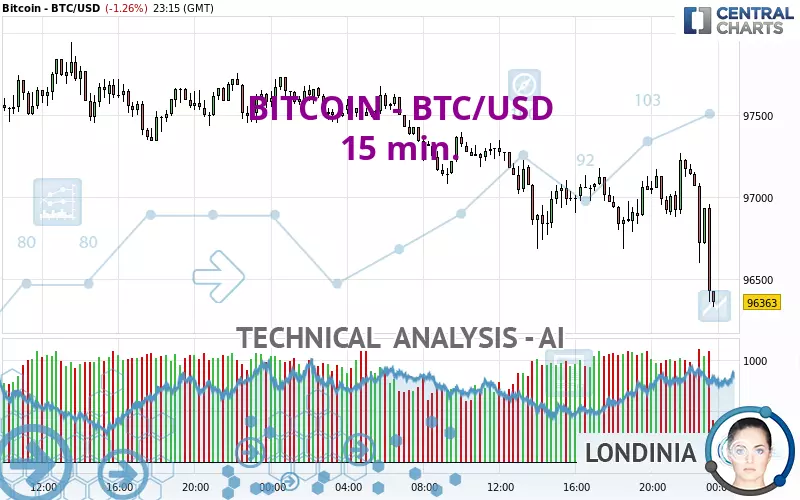
The BITCOIN - BTC/USD price is 96,357.27 USD. The price is lower by -1.27% since the last closing and was between 96,330.16 USD and 97,727.79 USD. This implies that the price is at +0.03% from its lowest and at -1.40% from its highest.A bearish opening was detected by the Central Gaps scanner. Sellers are trying to impose a bearish trend in the very short term.
Bullish opening
Type : Bullish
Timeframe : Openning
Bearish opening
Type : Bearish
Timeframe : Openning
A study of price movements over other periods shows the following variations:
Technical
Technical analysis of BITCOIN - BTC/USD in 15 min. shows a overall strongly bearish trend. 92.86% of the signals given by moving averages are bearish. This strongly bearish trend is supported by the strong bearish signals given by short-term moving averages. The Central Indicators market scanner currently does not detect any result that concerns moving averages.
In fact, 11 technical indicators on 18 studied are currently bearish. Caution: the Central Indicators scanner currently detects an excess:
RSI indicator is oversold : under 30
Type : Neutral
Timeframe : 15 minutes
CCI indicator is oversold : under -100
Type : Neutral
Timeframe : 15 minutes
Williams %R indicator is oversold : under -80
Type : Neutral
Timeframe : 15 minutes
Pivot points : price is under support 2
Type : Neutral
Timeframe : 15 minutes
Price is back over the pivot point
Type : Bullish
Timeframe : Weekly
Price is back under the pivot point
Type : Bearish
Timeframe : Weekly
The analysis of the price chart with Central Patterns scanners does not return any result.
Central Candlesticks, the scanner specialised in Japanese candlesticks, detects these signals that could have an impact on the current short-term trend:
Bearish engulfing lines
Type : Bearish
Timeframe : 15 minutes
Three white soldiers
Type : Bullish
Timeframe : 15 minutes
| S3 | S2 | S1 | Price | R1 | R2 | R3 | |
|---|---|---|---|---|---|---|---|
| ProTrendLines | 94,100.73 | 94,756.27 | 95,660.43 | 96,357.27 | 97,333.78 | 98,126.17 | 99,125.21 |
| Change (%) | -2.34% | -1.66% | -0.72% | - | +1.01% | +1.84% | +2.87% |
| Change | -2,256.54 | -1,601.00 | -696.84 | - | +976.51 | +1,768.90 | +2,767.94 |
| Level | Minor | Minor | Intermediate | - | Minor | Intermediate | Intermediate |
To determine price objectives, it is also possible to use the pivot points. Here is the price position in relation to pivot points:
| Pivot points | S3 | S2 | S1 | PP | R1 | R2 | R3 |
|---|---|---|---|---|---|---|---|
| Standard | 96,507.16 | 96,877.78 | 97,236.69 | 97,607.31 | 97,966.22 | 98,336.84 | 98,695.75 |
| Camarilla | 97,394.99 | 97,461.86 | 97,528.74 | 97,595.61 | 97,662.48 | 97,729.36 | 97,796.23 |
| Woodie | 96,501.32 | 96,874.85 | 97,230.85 | 97,604.38 | 97,960.38 | 98,333.91 | 98,689.91 |
| Fibonacci | 96,877.78 | 97,156.46 | 97,328.63 | 97,607.31 | 97,885.99 | 98,058.16 | 98,336.84 |
| Pivot points | S3 | S2 | S1 | PP | R1 | R2 | R3 |
|---|---|---|---|---|---|---|---|
| Standard | 90,076.14 | 92,088.44 | 94,842.02 | 96,854.32 | 99,607.90 | 101,620.20 | 104,373.78 |
| Camarilla | 96,284.99 | 96,721.87 | 97,158.74 | 97,595.61 | 98,032.48 | 98,469.36 | 98,906.23 |
| Woodie | 90,446.79 | 92,273.76 | 95,212.67 | 97,039.64 | 99,978.55 | 101,805.52 | 104,744.43 |
| Fibonacci | 92,088.44 | 93,909.00 | 95,033.75 | 96,854.32 | 98,674.88 | 99,799.63 | 101,620.20 |
| Pivot points | S3 | S2 | S1 | PP | R1 | R2 | R3 |
|---|---|---|---|---|---|---|---|
| Standard | 71,450.13 | 80,340.46 | 91,374.33 | 100,264.66 | 111,298.53 | 120,188.86 | 131,222.73 |
| Camarilla | 96,929.06 | 98,755.44 | 100,581.83 | 102,408.21 | 104,234.60 | 106,060.98 | 107,887.37 |
| Woodie | 72,521.91 | 80,876.35 | 92,446.11 | 100,800.55 | 112,370.31 | 120,724.75 | 132,294.51 |
| Fibonacci | 80,340.46 | 87,951.50 | 92,653.61 | 100,264.66 | 107,875.70 | 112,577.81 | 120,188.86 |
Numerical data
The following are the details of the technical indicators and moving averages that were collected to generate this technical analysis:
| RSI (14): | 33.18 | |
| MACD (12,26,9): | -60.4600 | |
| Directional Movement: | -22.66 | |
| AROON (14): | -42.86 | |
| DEMA (21): | 96,874.64 | |
| Parabolic SAR (0,02-0,02-0,2): | 97,206.15 | |
| Elder Ray (13): | -259.02 | |
| Super Trend (3,10): | 97,201.54 | |
| Zig ZAG (10): | 96,410.04 | |
| VORTEX (21): | 0.8500 | |
| Stochastique (14,3,5): | 26.42 | |
| TEMA (21): | 96,842.08 | |
| Williams %R (14): | -86.75 | |
| Chande Momentum Oscillator (20): | -597.98 | |
| Repulse (5,40,3): | -0.4200 | |
| ROCnROLL: | 2 | |
| TRIX (15,9): | 0.0000 | |
| Courbe Coppock: | 0.19 |
| MA7: | 97,033.88 | |
| MA20: | 98,603.89 | |
| MA50: | 98,789.28 | |
| MA100: | 97,296.63 | |
| MAexp7: | 96,807.70 | |
| MAexp20: | 96,940.34 | |
| MAexp50: | 97,043.45 | |
| MAexp100: | 97,177.86 | |
| Price / MA7: | -0.70% | |
| Price / MA20: | -2.28% | |
| Price / MA50: | -2.46% | |
| Price / MA100: | -0.97% | |
| Price / MAexp7: | -0.47% | |
| Price / MAexp20: | -0.60% | |
| Price / MAexp50: | -0.71% | |
| Price / MAexp100: | -0.84% |
About author

Online


Add a comment
Comments
0 comments on the analysis BITCOIN - BTC/USD - 15 min.