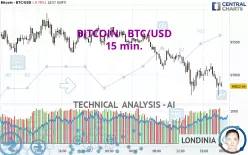
BITCOIN - BTC/USD - 15 min. - Technical analysis published on 02/16/2025 (GMT)
- 359
- 0
Click here for a new analysis!
- Timeframe : 15 min.
- - Analysis generated on
- Status : TARGET REACHED

Summary of the analysis

Additional analysis
Quotes
The BITCOIN - BTC/USD price is 96,822.68 USD. On the day, this instrument lost -0.79% and was traded between 96,684.30 USD and 97,727.79 USD over the period. The price is currently at +0.14% from its lowest and -0.93% from its highest.The Central Gaps scanner detects a bearish opening marking the presence of sellers ahead of buyers at the opening but not sufficiently marked to allow the price to register a quotation gap.
Bullish opening
Type : Bullish
Timeframe : Openning
Bearish opening
Type : Bearish
Timeframe : Openning
Here is a more detailed summary of the historical variations registered by BITCOIN - BTC/USD:
Technical
A technical analysis in 15 min. of this BITCOIN - BTC/USD chart shows a sharp bearish trend. 92.86% of the signals given by moving averages are bearish. This strongly bearish trend is supported by the strong bearish signals given by short-term moving averages. The Central Indicators scanner detects a bullish signal on moving averages that could impact this trend:
Bullish trend reversal : adaptative moving average 50
Type : Bullish
Timeframe : 15 minutes
The technical indicators are generally neutral. They do not provide relevant information on the direction of future price movements.
Caution: the Central Indicators scanner currently detects an excess:
Williams %R indicator is oversold : under -80
Type : Neutral
Timeframe : 15 minutes
Pivot points : price is under support 1
Type : Neutral
Timeframe : 15 minutes
Parabolic SAR indicator bearish reversal
Type : Bearish
Timeframe : 15 minutes
Price is back over the pivot point
Type : Bullish
Timeframe : Weekly
Momentum indicator is back under 0
Type : Bearish
Timeframe : 15 minutes
An analysis of the price chart with the Central Patterns scanner (detector of chart patterns and resistances and supports) shows a result that can have an impact on the price change:
Near horizontal resistance
Type : Bearish
Timeframe : 15 minutes
For a small rebound in the very short term, the Central Candlesticks scanner currently notes the presence of this bullish pattern in Japanese candlesticks:
Three white soldiers
Type : Bullish
Timeframe : 15 minutes
| S3 | S2 | S1 | Price | R1 | R2 | R3 | |
|---|---|---|---|---|---|---|---|
| ProTrendLines | 94,100.73 | 94,756.27 | 95,660.43 | 96,822.68 | 97,333.78 | 98,126.17 | 99,125.21 |
| Change (%) | -2.81% | -2.13% | -1.20% | - | +0.53% | +1.35% | +2.38% |
| Change | -2,721.95 | -2,066.41 | -1,162.25 | - | +511.10 | +1,303.49 | +2,302.53 |
| Level | Minor | Minor | Intermediate | - | Minor | Intermediate | Intermediate |
Attention could also be paid to pivot points to set price objectives:
| Pivot points | S3 | S2 | S1 | PP | R1 | R2 | R3 |
|---|---|---|---|---|---|---|---|
| Standard | 96,507.16 | 96,877.78 | 97,236.69 | 97,607.31 | 97,966.22 | 98,336.84 | 98,695.75 |
| Camarilla | 97,394.99 | 97,461.86 | 97,528.74 | 97,595.61 | 97,662.48 | 97,729.36 | 97,796.23 |
| Woodie | 96,501.32 | 96,874.85 | 97,230.85 | 97,604.38 | 97,960.38 | 98,333.91 | 98,689.91 |
| Fibonacci | 96,877.78 | 97,156.46 | 97,328.63 | 97,607.31 | 97,885.99 | 98,058.16 | 98,336.84 |
| Pivot points | S3 | S2 | S1 | PP | R1 | R2 | R3 |
|---|---|---|---|---|---|---|---|
| Standard | 90,076.14 | 92,088.44 | 94,842.02 | 96,854.32 | 99,607.90 | 101,620.20 | 104,373.78 |
| Camarilla | 96,284.99 | 96,721.87 | 97,158.74 | 97,595.61 | 98,032.48 | 98,469.36 | 98,906.23 |
| Woodie | 90,446.79 | 92,273.76 | 95,212.67 | 97,039.64 | 99,978.55 | 101,805.52 | 104,744.43 |
| Fibonacci | 92,088.44 | 93,909.00 | 95,033.75 | 96,854.32 | 98,674.88 | 99,799.63 | 101,620.20 |
| Pivot points | S3 | S2 | S1 | PP | R1 | R2 | R3 |
|---|---|---|---|---|---|---|---|
| Standard | 71,450.13 | 80,340.46 | 91,374.33 | 100,264.66 | 111,298.53 | 120,188.86 | 131,222.73 |
| Camarilla | 96,929.06 | 98,755.44 | 100,581.83 | 102,408.21 | 104,234.60 | 106,060.98 | 107,887.37 |
| Woodie | 72,521.91 | 80,876.35 | 92,446.11 | 100,800.55 | 112,370.31 | 120,724.75 | 132,294.51 |
| Fibonacci | 80,340.46 | 87,951.50 | 92,653.61 | 100,264.66 | 107,875.70 | 112,577.81 | 120,188.86 |
Numerical data
The following are the details of the technical indicators and moving averages that were collected to generate this technical analysis:
| RSI (14): | 43.32 | |
| MACD (12,26,9): | -38.1600 | |
| Directional Movement: | -5.91 | |
| AROON (14): | 71.43 | |
| DEMA (21): | 96,993.11 | |
| Parabolic SAR (0,02-0,02-0,2): | 96,945.17 | |
| Elder Ray (13): | -52.60 | |
| Super Trend (3,10): | 97,215.05 | |
| Zig ZAG (10): | 96,954.83 | |
| VORTEX (21): | 0.9400 | |
| Stochastique (14,3,5): | 50.12 | |
| TEMA (21): | 97,022.52 | |
| Williams %R (14): | -74.64 | |
| Chande Momentum Oscillator (20): | 20.26 | |
| Repulse (5,40,3): | -0.0500 | |
| ROCnROLL: | 2 | |
| TRIX (15,9): | -0.0100 | |
| Courbe Coppock: | 0.18 |
| MA7: | 97,112.36 | |
| MA20: | 98,611.69 | |
| MA50: | 98,795.83 | |
| MA100: | 97,301.38 | |
| MAexp7: | 97,021.41 | |
| MAexp20: | 97,056.14 | |
| MAexp50: | 97,172.31 | |
| MAexp100: | 97,288.69 | |
| Price / MA7: | -0.30% | |
| Price / MA20: | -1.81% | |
| Price / MA50: | -2.00% | |
| Price / MA100: | -0.49% | |
| Price / MAexp7: | -0.20% | |
| Price / MAexp20: | -0.24% | |
| Price / MAexp50: | -0.36% | |
| Price / MAexp100: | -0.48% |
About author

Online


Add a comment
Comments
0 comments on the analysis BITCOIN - BTC/USD - 15 min.