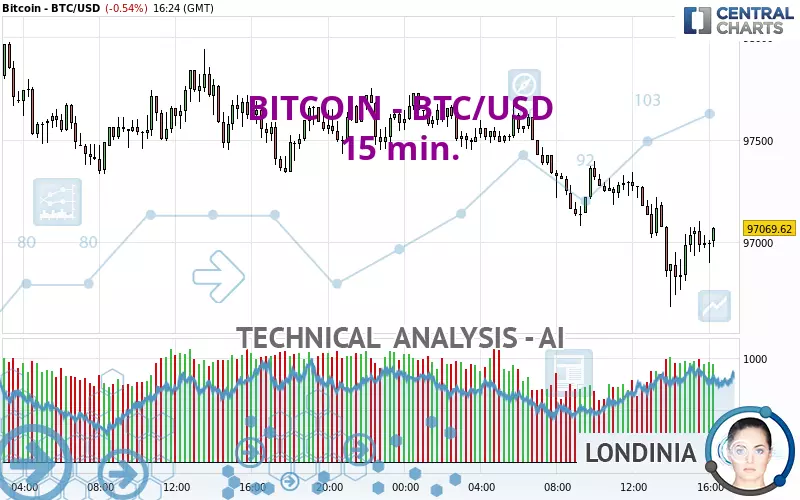
BITCOIN - BTC/USD - 15 min. - Technical analysis published on 02/16/2025 (GMT)
- 157
- 0
Click here for a new analysis!
- Timeframe : 15 min.
- - Analysis generated on
- Status : TARGET REACHED
Summary of the analysis

Additional analysis
Quotes
The BITCOIN - BTC/USD price is 97,069.17 USD. The price is lower by -0.54% since the last closing with the lowest point at 96,684.30 USD and the highest point at 97,727.79 USD. The deviation from the price is +0.40% for the low point and -0.67% for the high point.A bearish opening was detected by the Central Gaps scanner. Sellers are trying to impose a bearish trend in the very short term.
Bullish opening
Type : Bullish
Timeframe : Openning
Bearish opening
Type : Bearish
Timeframe : Openning
So that you have an overall view of the price change, here is a table showing the variations over several periods:
Technical
Technical analysis of BITCOIN - BTC/USD in 15 min. shows an overall bearish trend. 78.57% of the signals given by moving averages are bearish. Caution: as the signals currently given by short-term moving averages are rather neutral, the bearish trend could slow down. The Central Indicators scanner detects a bullish signal on moving averages that could impact this trend:
Bullish trend reversal : adaptative moving average 50
Type : Bullish
Timeframe : 15 minutes
The technical indicators are generally neutral. They do not provide relevant information on the direction of future price movements.
Caution: the Central Indicators scanner currently detects an excess:
MACD indicator: bullish divergence
Type : Bullish
Timeframe : 15 minutes
Pivot points : price is under support 1
Type : Neutral
Timeframe : 15 minutes
Price is back over the pivot point
Type : Bullish
Timeframe : Weekly
The Central Patterns scanner, which studies chart patterns, resistances and supports, has identified this signal:
Near horizontal resistance
Type : Bearish
Timeframe : 15 minutes
For a small rebound in the very short term, the Central Candlesticks scanner currently notes the presence of this bullish pattern in Japanese candlesticks:
Three white soldiers
Type : Bullish
Timeframe : 15 minutes
| S3 | S2 | S1 | Price | R1 | R2 | R3 | |
|---|---|---|---|---|---|---|---|
| ProTrendLines | 94,100.73 | 94,756.27 | 95,660.43 | 97,069.17 | 97,333.78 | 98,126.17 | 99,125.21 |
| Change (%) | -3.06% | -2.38% | -1.45% | - | +0.27% | +1.09% | +2.12% |
| Change | -2,968.44 | -2,312.90 | -1,408.74 | - | +264.61 | +1,057.00 | +2,056.04 |
| Level | Minor | Minor | Intermediate | - | Minor | Intermediate | Intermediate |
Pivot points can also be used to set your price objectives. Here is the price situation in relation to pivot points:
| Pivot points | S3 | S2 | S1 | PP | R1 | R2 | R3 |
|---|---|---|---|---|---|---|---|
| Standard | 96,507.16 | 96,877.78 | 97,236.69 | 97,607.31 | 97,966.22 | 98,336.84 | 98,695.75 |
| Camarilla | 97,394.99 | 97,461.86 | 97,528.74 | 97,595.61 | 97,662.48 | 97,729.36 | 97,796.23 |
| Woodie | 96,501.32 | 96,874.85 | 97,230.85 | 97,604.38 | 97,960.38 | 98,333.91 | 98,689.91 |
| Fibonacci | 96,877.78 | 97,156.46 | 97,328.63 | 97,607.31 | 97,885.99 | 98,058.16 | 98,336.84 |
| Pivot points | S3 | S2 | S1 | PP | R1 | R2 | R3 |
|---|---|---|---|---|---|---|---|
| Standard | 90,076.14 | 92,088.44 | 94,842.02 | 96,854.32 | 99,607.90 | 101,620.20 | 104,373.78 |
| Camarilla | 96,284.99 | 96,721.87 | 97,158.74 | 97,595.61 | 98,032.48 | 98,469.36 | 98,906.23 |
| Woodie | 90,446.79 | 92,273.76 | 95,212.67 | 97,039.64 | 99,978.55 | 101,805.52 | 104,744.43 |
| Fibonacci | 92,088.44 | 93,909.00 | 95,033.75 | 96,854.32 | 98,674.88 | 99,799.63 | 101,620.20 |
| Pivot points | S3 | S2 | S1 | PP | R1 | R2 | R3 |
|---|---|---|---|---|---|---|---|
| Standard | 71,450.13 | 80,340.46 | 91,374.33 | 100,264.66 | 111,298.53 | 120,188.86 | 131,222.73 |
| Camarilla | 96,929.06 | 98,755.44 | 100,581.83 | 102,408.21 | 104,234.60 | 106,060.98 | 107,887.37 |
| Woodie | 72,521.91 | 80,876.35 | 92,446.11 | 100,800.55 | 112,370.31 | 120,724.75 | 132,294.51 |
| Fibonacci | 80,340.46 | 87,951.50 | 92,653.61 | 100,264.66 | 107,875.70 | 112,577.81 | 120,188.86 |
Numerical data
The following are the details of the technical indicators and moving averages that were collected to generate this technical analysis:
| RSI (14): | 37.96 | |
| MACD (12,26,9): | -94.2500 | |
| Directional Movement: | -10.07 | |
| AROON (14): | -42.86 | |
| DEMA (21): | 96,919.87 | |
| Parabolic SAR (0,02-0,02-0,2): | 96,739.51 | |
| Elder Ray (13): | -66.56 | |
| Super Trend (3,10): | 97,215.05 | |
| Zig ZAG (10): | 96,926.60 | |
| VORTEX (21): | 0.8900 | |
| Stochastique (14,3,5): | 49.33 | |
| TEMA (21): | 96,913.51 | |
| Williams %R (14): | -49.46 | |
| Chande Momentum Oscillator (20): | -157.48 | |
| Repulse (5,40,3): | 0.0000 | |
| ROCnROLL: | 2 | |
| TRIX (15,9): | -0.0100 | |
| Courbe Coppock: | 0.52 |
| MA7: | 97,109.84 | |
| MA20: | 98,608.32 | |
| MA50: | 98,794.81 | |
| MA100: | 97,300.75 | |
| MAexp7: | 96,966.16 | |
| MAexp20: | 97,049.06 | |
| MAexp50: | 97,209.69 | |
| MAexp100: | 97,325.93 | |
| Price / MA7: | -0.04% | |
| Price / MA20: | -1.56% | |
| Price / MA50: | -1.75% | |
| Price / MA100: | -0.24% | |
| Price / MAexp7: | +0.11% | |
| Price / MAexp20: | +0.02% | |
| Price / MAexp50: | -0.14% | |
| Price / MAexp100: | -0.26% |
About author

Online


Add a comment
Comments
0 comments on the analysis BITCOIN - BTC/USD - 15 min.