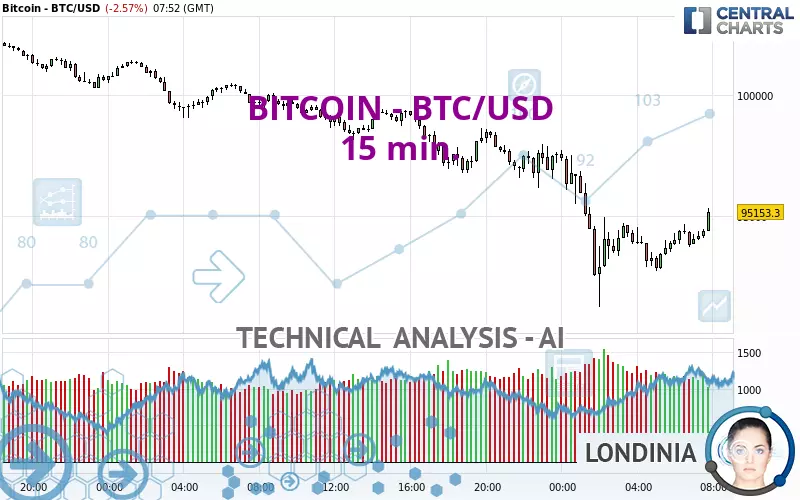
BITCOIN - BTC/USD - 15 min. - Technical analysis published on 02/03/2025 (GMT)
- 136
- 0
Click here for a new analysis!
- Timeframe : 15 min.
- - Analysis generated on
- Status : LEVEL MAINTAINED

Summary of the analysis

Additional analysis
Quotes
The BITCOIN - BTC/USD price is 95,166.84 USD. On the day, this instrument lost -2.56% and was between 91,257.37 USD and 97,725.08 USD. This implies that the price is at +4.28% from its lowest and at -2.62% from its highest.The Central Gaps scanner detects a bearish opening marking the presence of sellers ahead of buyers at the opening but not sufficiently marked to allow the price to register a quotation gap.
Bearish opening
Type : Bearish
Timeframe : Openning
Here is a more detailed summary of the historical variations registered by BITCOIN - BTC/USD:
Near a new LOW record (1st january)
Type : Bearish
Timeframe : Weekly
Near a new LOW record (1 month)
Type : Bearish
Timeframe : Weekly
Technical
Technical analysis of this 15 min. chart of BITCOIN - BTC/USD indicates that the overall trend is bearish. 78.57% of the signals given by moving averages are bearish. Caution: as the signals currently given by short-term moving averages are rather neutral, the bearish trend could slow down. The Central Indicators scanner does not detect any result on moving averages that would impact this trend.
In fact, according to the parameters integrated into the Central Analyzer system, only 9 technical indicators out of 18 analysed are currently bullish. Caution: the Central Indicators scanner currently detects an excess:
Williams %R indicator is overbought : over -20
Type : Neutral
Timeframe : 15 minutes
Pivot points : price is under support 1
Type : Neutral
Timeframe : 15 minutes
Pivot points : price is under support 1
Type : Neutral
Timeframe : Weekly
The Central Patterns scanner, which studies chart patterns, resistances and supports, has identified this signal:
Resistance of channel is broken
Type : Bullish
Timeframe : 15 minutes
For a small setback in the very short term, the Central Candlesticks scanner currently notes the presence of this bearish pattern in Japanese candlesticks:
Bearish harami
Type : Bearish
Timeframe : 15 minutes
| S3 | S2 | S1 | Price | R1 | R2 | R3 | |
|---|---|---|---|---|---|---|---|
| ProTrendLines | 53,966.27 | 67,552.80 | 92,484.84 | 95,166.84 | 97,705.02 | 99,125.21 | 100,210.19 |
| Change (%) | -43.29% | -29.02% | -2.82% | - | +2.67% | +4.16% | +5.30% |
| Change | -41,200.57 | -27,614.04 | -2,682.00 | - | +2,538.18 | +3,958.37 | +5,043.35 |
| Level | Major | Major | Major | - | Intermediate | Intermediate | Intermediate |
Attention could also be paid to pivot points to set price objectives:
| Pivot points | S3 | S2 | S1 | PP | R1 | R2 | R3 |
|---|---|---|---|---|---|---|---|
| Standard | 90,109.67 | 93,128.98 | 95,397.99 | 98,417.30 | 100,686.31 | 103,705.62 | 105,974.63 |
| Camarilla | 96,212.72 | 96,697.49 | 97,182.25 | 97,667.01 | 98,151.77 | 98,636.54 | 99,121.30 |
| Woodie | 89,734.53 | 92,941.41 | 95,022.85 | 98,229.73 | 100,311.17 | 103,518.05 | 105,599.49 |
| Fibonacci | 93,128.98 | 95,149.12 | 96,397.16 | 98,417.30 | 100,437.44 | 101,685.48 | 103,705.62 |
| Pivot points | S3 | S2 | S1 | PP | R1 | R2 | R3 |
|---|---|---|---|---|---|---|---|
| Standard | 87,989.71 | 92,847.36 | 96,733.68 | 101,591.33 | 105,477.65 | 110,335.30 | 114,221.62 |
| Camarilla | 98,215.40 | 99,016.93 | 99,818.46 | 100,619.99 | 101,421.52 | 102,223.05 | 103,024.58 |
| Woodie | 87,504.04 | 92,604.53 | 96,248.01 | 101,348.50 | 104,991.98 | 110,092.47 | 113,735.95 |
| Fibonacci | 92,847.36 | 96,187.56 | 98,251.14 | 101,591.33 | 104,931.53 | 106,995.11 | 110,335.30 |
| Pivot points | S3 | S2 | S1 | PP | R1 | R2 | R3 |
|---|---|---|---|---|---|---|---|
| Standard | 71,450.13 | 80,340.46 | 91,374.33 | 100,264.66 | 111,298.53 | 120,188.86 | 131,222.73 |
| Camarilla | 96,929.06 | 98,755.44 | 100,581.83 | 102,408.21 | 104,234.60 | 106,060.98 | 107,887.37 |
| Woodie | 72,521.91 | 80,876.35 | 92,446.11 | 100,800.55 | 112,370.31 | 120,724.75 | 132,294.51 |
| Fibonacci | 80,340.46 | 87,951.50 | 92,653.61 | 100,264.66 | 107,875.70 | 112,577.81 | 120,188.86 |
Numerical data
The following are the details of the technical indicators and moving averages that were collected to generate this technical analysis:
| RSI (14): | 46.57 | |
| MACD (12,26,9): | -421.7100 | |
| Directional Movement: | -8.25 | |
| AROON (14): | 50.00 | |
| DEMA (21): | 93,476.45 | |
| Parabolic SAR (0,02-0,02-0,2): | 92,392.16 | |
| Elder Ray (13): | 105.53 | |
| Super Trend (3,10): | 95,630.45 | |
| Zig ZAG (10): | 94,209.49 | |
| VORTEX (21): | 1.2000 | |
| Stochastique (14,3,5): | 70.49 | |
| TEMA (21): | 93,880.84 | |
| Williams %R (14): | -15.48 | |
| Chande Momentum Oscillator (20): | 883.13 | |
| Repulse (5,40,3): | -0.1100 | |
| ROCnROLL: | -1 | |
| TRIX (15,9): | -0.0900 | |
| Courbe Coppock: | 0.42 |
| MA7: | 100,685.78 | |
| MA20: | 102,237.33 | |
| MA50: | 98,994.48 | |
| MA100: | 93,884.92 | |
| MAexp7: | 94,140.06 | |
| MAexp20: | 94,181.77 | |
| MAexp50: | 95,384.05 | |
| MAexp100: | 96,890.54 | |
| Price / MA7: | -5.48% | |
| Price / MA20: | -6.92% | |
| Price / MA50: | -3.87% | |
| Price / MA100: | +1.37% | |
| Price / MAexp7: | +1.09% | |
| Price / MAexp20: | +1.05% | |
| Price / MAexp50: | -0.23% | |
| Price / MAexp100: | -1.78% |
About author

Online


Add a comment
Comments
0 comments on the analysis BITCOIN - BTC/USD - 15 min.