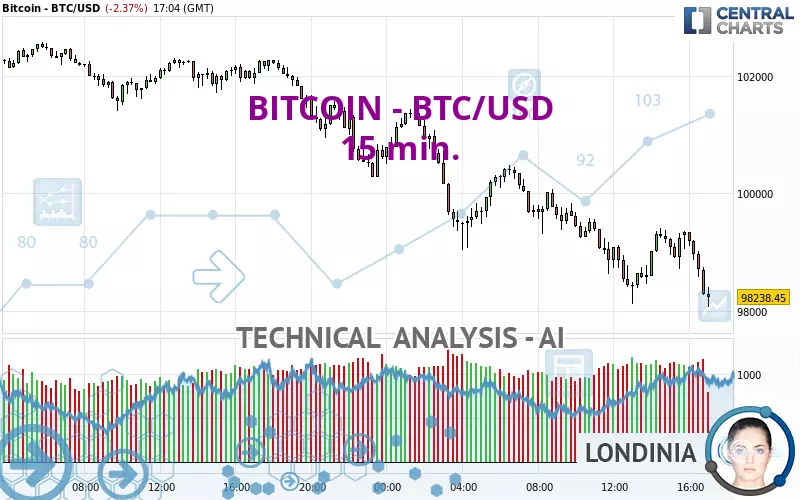
BITCOIN - BTC/USD - 15 min. - Technical analysis published on 02/02/2025 (GMT)
- 253
- 0
Click here for a new analysis!
- Timeframe : 15 min.
- - Analysis generated on
- Status : TARGET REACHED

Summary of the analysis

Additional analysis
Quotes
The BITCOIN - BTC/USD rating is 98,238.44 USD. The price registered a decrease of -2.37% on the session with the lowest point at 98,067.51 USD and the highest point at 101,436.60 USD. The deviation from the price is +0.17% for the low point and -3.15% for the high point.The Central Gaps scanner detects a bearish opening. A small advantage for sellers in the very short term.
Bearish opening
Type : Bearish
Timeframe : Openning
A study of price movements over other periods shows the following variations:
Near a new HIGH record (1 year)
Type : Bullish
Timeframe : Weekly
Near a new HIGH record (1st january)
Type : Bullish
Timeframe : Weekly
Near a new HIGH record (1 month)
Type : Bullish
Timeframe : Weekly
Technical
A technical analysis in 15 min. of this BITCOIN - BTC/USD chart shows a sharp bearish trend. 92.86% of the signals given by moving averages are bearish. This strongly bearish trend is supported by the strong bearish signals given by short-term moving averages. The Central Indicators market scanner currently does not detect any result that concerns moving averages.
In fact, of the 18 technical indicators analysed by Central Analyzer, 4 are bullish, 1 are neutral and 13 are bearish. But beware of excesses. The Central Indicators scanner currently detects this:
CCI indicator: bullish divergence
Type : Bullish
Timeframe : 15 minutes
RSI indicator: bullish divergence
Type : Bullish
Timeframe : 15 minutes
Williams %R indicator is overbought : over -20
Type : Neutral
Timeframe : 15 minutes
Pivot points : price is under support 3
Type : Neutral
Timeframe : 15 minutes
RSI indicator is back under 50
Type : Bearish
Timeframe : 15 minutes
Ichimoku - Bullish crossover : Tenkan & Kijun
Type : Bullish
Timeframe : 15 minutes
Price is back under the pivot point
Type : Bearish
Timeframe : Weekly
The Central Patterns scanner, which studies chart patterns, resistances and supports, has identified this signal:
Near support of channel
Type : Bullish
Timeframe : 15 minutes
The Central Candlesticks scanner, specialised in Japanese candlesticks, did not identify any signals.
| S3 | S2 | S1 | Price | R1 | R2 | R3 | |
|---|---|---|---|---|---|---|---|
| ProTrendLines | 67,552.80 | 92,484.84 | 97,705.02 | 98,238.44 | 99,125.21 | 100,210.19 | 101,517.50 |
| Change (%) | -31.24% | -5.86% | -0.54% | - | +0.90% | +2.01% | +3.34% |
| Change | -30,685.64 | -5,753.60 | -533.42 | - | +886.77 | +1,971.75 | +3,279.06 |
| Level | Major | Major | Intermediate | - | Intermediate | Intermediate | Intermediate |
To determine price objectives, it is also possible to use the pivot points. Here is the price position in relation to pivot points:
| Pivot points | S3 | S2 | S1 | PP | R1 | R2 | R3 |
|---|---|---|---|---|---|---|---|
| Standard | 97,180.29 | 98,725.26 | 99,672.62 | 101,217.59 | 102,164.95 | 103,709.92 | 104,657.28 |
| Camarilla | 99,934.60 | 100,163.06 | 100,391.53 | 100,619.99 | 100,848.45 | 101,076.92 | 101,305.38 |
| Woodie | 96,881.50 | 98,575.86 | 99,373.83 | 101,068.19 | 101,866.16 | 103,560.52 | 104,358.49 |
| Fibonacci | 98,725.26 | 99,677.33 | 100,265.52 | 101,217.59 | 102,169.66 | 102,757.85 | 103,709.92 |
| Pivot points | S3 | S2 | S1 | PP | R1 | R2 | R3 |
|---|---|---|---|---|---|---|---|
| Standard | 87,989.71 | 92,847.36 | 96,733.68 | 101,591.33 | 105,477.65 | 110,335.30 | 114,221.62 |
| Camarilla | 98,215.40 | 99,016.93 | 99,818.46 | 100,619.99 | 101,421.52 | 102,223.05 | 103,024.58 |
| Woodie | 87,504.04 | 92,604.53 | 96,248.01 | 101,348.50 | 104,991.98 | 110,092.47 | 113,735.95 |
| Fibonacci | 92,847.36 | 96,187.56 | 98,251.14 | 101,591.33 | 104,931.53 | 106,995.11 | 110,335.30 |
| Pivot points | S3 | S2 | S1 | PP | R1 | R2 | R3 |
|---|---|---|---|---|---|---|---|
| Standard | 71,450.13 | 80,340.46 | 91,374.33 | 100,264.66 | 111,298.53 | 120,188.86 | 131,222.73 |
| Camarilla | 96,929.06 | 98,755.44 | 100,581.83 | 102,408.21 | 104,234.60 | 106,060.98 | 107,887.37 |
| Woodie | 72,521.91 | 80,876.35 | 92,446.11 | 100,800.55 | 112,370.31 | 120,724.75 | 132,294.51 |
| Fibonacci | 80,340.46 | 87,951.50 | 92,653.61 | 100,264.66 | 107,875.70 | 112,577.81 | 120,188.86 |
Numerical data
The following is the status of the technical indicators and moving averages at the time of publication of this technical analysis:
| RSI (14): | 37.22 | |
| MACD (12,26,9): | -208.0100 | |
| Directional Movement: | -20.69 | |
| AROON (14): | -64.29 | |
| DEMA (21): | 98,619.45 | |
| Parabolic SAR (0,02-0,02-0,2): | 99,336.25 | |
| Elder Ray (13): | -458.54 | |
| Super Trend (3,10): | 99,372.18 | |
| Zig ZAG (10): | 98,397.30 | |
| VORTEX (21): | 0.9500 | |
| Stochastique (14,3,5): | 17.22 | |
| TEMA (21): | 98,607.42 | |
| Williams %R (14): | -85.55 | |
| Chande Momentum Oscillator (20): | -935.89 | |
| Repulse (5,40,3): | -0.4400 | |
| ROCnROLL: | 2 | |
| TRIX (15,9): | -0.0200 | |
| Courbe Coppock: | 0.13 |
| MA7: | 101,869.18 | |
| MA20: | 102,397.09 | |
| MA50: | 99,212.85 | |
| MA100: | 93,620.39 | |
| MAexp7: | 98,606.44 | |
| MAexp20: | 98,879.13 | |
| MAexp50: | 99,335.18 | |
| MAexp100: | 100,068.42 | |
| Price / MA7: | -3.56% | |
| Price / MA20: | -4.06% | |
| Price / MA50: | -0.98% | |
| Price / MA100: | +4.93% | |
| Price / MAexp7: | -0.37% | |
| Price / MAexp20: | -0.65% | |
| Price / MAexp50: | -1.10% | |
| Price / MAexp100: | -1.83% |
About author

Online


Add a comment
Comments
0 comments on the analysis BITCOIN - BTC/USD - 15 min.