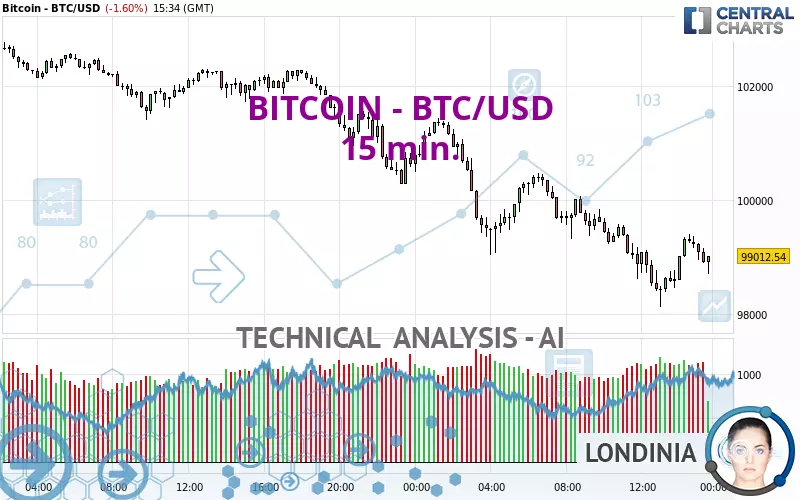
BITCOIN - BTC/USD - 15 min. - Technical analysis published on 02/02/2025 (GMT)
- 85
- 0
- Timeframe : 15 min.
- - Analysis generated on
- Status : IN PROGRESS...

Summary of the analysis

Additional analysis
Quotes
The BITCOIN - BTC/USD rating is 99,024.45 USD. On the day, this instrument lost -1.59% and was traded between 98,125.57 USD and 101,436.60 USD over the period. The price is currently at +0.92% from its lowest and -2.38% from its highest.A bearish opening was detected by the Central Gaps scanner. Sellers are trying to impose a bearish trend in the very short term.
Bearish opening
Type : Bearish
Timeframe : Openning
A study of price movements over other periods shows the following variations:
Near a new HIGH record (1 year)
Type : Bullish
Timeframe : Weekly
Near a new HIGH record (1st january)
Type : Bullish
Timeframe : Weekly
Near a new HIGH record (1 month)
Type : Bullish
Timeframe : Weekly
Technical
A technical analysis in 15 min. of this BITCOIN - BTC/USD chart shows a sharp bearish trend. 82.14% of the signals given by moving averages are bearish. Caution: as the signals currently given by short-term moving averages are rather neutral, the strongly bearish trend is showing signs of running out of steam. The Central Indicators market scanner currently does not detect any result that concerns moving averages.
In fact, according to the parameters integrated into the Central Analyzer system, 11 technical indicators out of 18 analysed are currently bullish. Other results related to technical indicators were also found by the Central Indicators scanner:
Pivot points : price is under support 1
Type : Neutral
Timeframe : 15 minutes
Price is back under the pivot point
Type : Bearish
Timeframe : Weekly
Momentum indicator is back under 0
Type : Bearish
Timeframe : 15 minutes
An analysis of the price chart with the Central Patterns scanner (detector of chart patterns and resistances and supports) shows a result that can have an impact on the price change:
Near support of channel
Type : Bullish
Timeframe : 15 minutes
The Central Candlesticks scanner, specialised in Japanese candlesticks, did not identify any signals.
| S3 | S2 | S1 | Price | R1 | R2 | R3 | |
|---|---|---|---|---|---|---|---|
| ProTrendLines | 67,552.80 | 92,484.84 | 97,705.02 | 99,024.45 | 99,125.21 | 100,210.19 | 101,517.50 |
| Change (%) | -31.78% | -6.60% | -1.33% | - | +0.10% | +1.20% | +2.52% |
| Change | -31,471.65 | -6,539.61 | -1,319.43 | - | +100.76 | +1,185.74 | +2,493.05 |
| Level | Major | Major | Intermediate | - | Intermediate | Intermediate | Intermediate |
To determine price objectives, it is also possible to use the pivot points. Here is the price position in relation to pivot points:
| Pivot points | S3 | S2 | S1 | PP | R1 | R2 | R3 |
|---|---|---|---|---|---|---|---|
| Standard | 97,180.29 | 98,725.26 | 99,672.62 | 101,217.59 | 102,164.95 | 103,709.92 | 104,657.28 |
| Camarilla | 99,934.60 | 100,163.06 | 100,391.53 | 100,619.99 | 100,848.45 | 101,076.92 | 101,305.38 |
| Woodie | 96,881.50 | 98,575.86 | 99,373.83 | 101,068.19 | 101,866.16 | 103,560.52 | 104,358.49 |
| Fibonacci | 98,725.26 | 99,677.33 | 100,265.52 | 101,217.59 | 102,169.66 | 102,757.85 | 103,709.92 |
| Pivot points | S3 | S2 | S1 | PP | R1 | R2 | R3 |
|---|---|---|---|---|---|---|---|
| Standard | 87,989.71 | 92,847.36 | 96,733.68 | 101,591.33 | 105,477.65 | 110,335.30 | 114,221.62 |
| Camarilla | 98,215.40 | 99,016.93 | 99,818.46 | 100,619.99 | 101,421.52 | 102,223.05 | 103,024.58 |
| Woodie | 87,504.04 | 92,604.53 | 96,248.01 | 101,348.50 | 104,991.98 | 110,092.47 | 113,735.95 |
| Fibonacci | 92,847.36 | 96,187.56 | 98,251.14 | 101,591.33 | 104,931.53 | 106,995.11 | 110,335.30 |
| Pivot points | S3 | S2 | S1 | PP | R1 | R2 | R3 |
|---|---|---|---|---|---|---|---|
| Standard | 71,450.13 | 80,340.46 | 91,374.33 | 100,264.66 | 111,298.53 | 120,188.86 | 131,222.73 |
| Camarilla | 96,929.06 | 98,755.44 | 100,581.83 | 102,408.21 | 104,234.60 | 106,060.98 | 107,887.37 |
| Woodie | 72,521.91 | 80,876.35 | 92,446.11 | 100,800.55 | 112,370.31 | 120,724.75 | 132,294.51 |
| Fibonacci | 80,340.46 | 87,951.50 | 92,653.61 | 100,264.66 | 107,875.70 | 112,577.81 | 120,188.86 |
Numerical data
The following is the status of technical indicators and moving averages registered at the time this technical analysis was created:
| RSI (14): | 48.27 | |
| MACD (12,26,9): | -132.2900 | |
| Directional Movement: | -6.81 | |
| AROON (14): | 50.00 | |
| DEMA (21): | 98,871.07 | |
| Parabolic SAR (0,02-0,02-0,2): | 98,536.86 | |
| Elder Ray (13): | 89.89 | |
| Super Trend (3,10): | 99,450.65 | |
| Zig ZAG (10): | 99,086.19 | |
| VORTEX (21): | 0.9300 | |
| Stochastique (14,3,5): | 84.95 | |
| TEMA (21): | 99,003.23 | |
| Williams %R (14): | -23.52 | |
| Chande Momentum Oscillator (20): | 4.48 | |
| Repulse (5,40,3): | 0.0100 | |
| ROCnROLL: | -1 | |
| TRIX (15,9): | -0.0300 | |
| Courbe Coppock: | 0.10 |
| MA7: | 101,987.79 | |
| MA20: | 102,443.75 | |
| MA50: | 99,230.81 | |
| MA100: | 93,629.19 | |
| MAexp7: | 99,081.62 | |
| MAexp20: | 99,112.02 | |
| MAexp50: | 99,562.20 | |
| MAexp100: | 100,295.99 | |
| Price / MA7: | -2.91% | |
| Price / MA20: | -3.34% | |
| Price / MA50: | -0.21% | |
| Price / MA100: | +5.76% | |
| Price / MAexp7: | -0.06% | |
| Price / MAexp20: | -0.09% | |
| Price / MAexp50: | -0.54% | |
| Price / MAexp100: | -1.27% |
About author

Online


Add a comment
Comments
0 comments on the analysis BITCOIN - BTC/USD - 15 min.