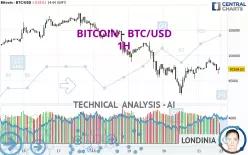
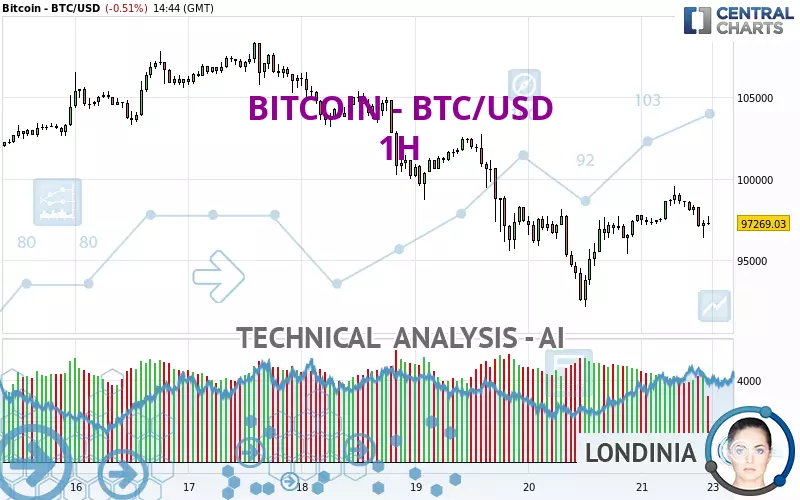
BITCOIN - BTC/USD - 1H - Technical analysis published on 12/21/2024 (GMT)
- 366
- 0
- Who voted?
Click here for a new analysis!
- Timeframe : 1H
- - Analysis generated on
- Status : LEVEL MAINTAINED
Summary of the analysis

Additional analysis
Quotes
The BITCOIN - BTC/USD rating is 97,269.02 USD. The price is lower by -0.51% since the last closing with the lowest point at 96,376.66 USD and the highest point at 99,531.12 USD. The deviation from the price is +0.93% for the low point and -2.27% for the high point.The Central Gaps scanner detects a bullish opening marking the presence of buyers ahead of sellers at the opening but not sufficiently marked to allow the price to register a quotation gap.
Bullish opening
Type : Bullish
Timeframe : Openning
Here is a more detailed summary of the historical variations registered by BITCOIN - BTC/USD:
New HIGH record (5 years)
Type : Bullish
Timeframe : Weekly
New HIGH record (1st january)
Type : Bullish
Timeframe : Weekly
Technical
A technical analysis in 1H of this BITCOIN - BTC/USD chart shows a sharp bearish trend. 85.71% of the signals given by moving averages are bearish. This strongly bearish trend is showing signs of slowing down given the slightly bearish signals given by short-term moving averages. The Central Indicators scanner detects a bullish signal on moving averages that could impact this trend:
Bullish price crossover with Moving Average 50
Type : Bullish
Timeframe : 1 hour
In fact, of the 18 technical indicators analysed by Central Analyzer, 5 are bullish, 6 are neutral and 7 are bearish. Other results related to technical indicators were also found by the Central Indicators scanner:
Price is back under the pivot point
Type : Bearish
Timeframe : Weekly
Momentum indicator is back over 0
Type : Bullish
Timeframe : 1 hour
Central Patterns, the market scanner focusing on chart patterns, resistances and supports found this result:
Near support of channel
Type : Bullish
Timeframe : 1 hour
Central Candlesticks, the scanner specialised in Japanese candlesticks, detects a bearish signal that could support the hypothesis of a small drop in the very short term:
Bearish doji star
Type : Bearish
Timeframe : 1 hour
| S3 | S2 | S1 | Price | R1 | R2 | R3 | |
|---|---|---|---|---|---|---|---|
| ProTrendLines | 73,118.00 | 92,156.73 | 95,568.84 | 97,269.02 | 97,722.39 | 99,008.00 | 102,686.20 |
| Change (%) | -24.83% | -5.26% | -1.75% | - | +0.47% | +1.79% | +5.57% |
| Change | -24,151.02 | -5,112.29 | -1,700.18 | - | +453.37 | +1,738.98 | +5,417.18 |
| Level | Major | Intermediate | Minor | - | Minor | Intermediate | Major |
Pivot points can also be used to set your price objectives. Here is the price situation in relation to pivot points:
| Pivot points | S3 | S2 | S1 | PP | R1 | R2 | R3 |
|---|---|---|---|---|---|---|---|
| Standard | 87,937.37 | 90,047.05 | 93,908.12 | 96,017.80 | 99,878.87 | 101,988.55 | 105,849.62 |
| Camarilla | 96,127.23 | 96,674.55 | 97,221.87 | 97,769.19 | 98,316.51 | 98,863.83 | 99,411.15 |
| Woodie | 88,813.07 | 90,484.90 | 94,783.82 | 96,455.65 | 100,754.57 | 102,426.40 | 106,725.32 |
| Fibonacci | 90,047.05 | 92,327.88 | 93,736.97 | 96,017.80 | 98,298.63 | 99,707.72 | 101,988.55 |
| Pivot points | S3 | S2 | S1 | PP | R1 | R2 | R3 |
|---|---|---|---|---|---|---|---|
| Standard | 87,906.86 | 91,104.48 | 96,253.72 | 99,451.34 | 104,600.58 | 107,798.20 | 112,947.44 |
| Camarilla | 99,107.56 | 99,872.69 | 100,637.82 | 101,402.95 | 102,168.08 | 102,933.21 | 103,698.34 |
| Woodie | 88,882.66 | 91,592.39 | 97,229.52 | 99,939.25 | 105,576.38 | 108,286.11 | 113,923.24 |
| Fibonacci | 91,104.48 | 94,292.98 | 96,262.84 | 99,451.34 | 102,639.84 | 104,609.70 | 107,798.20 |
| Pivot points | S3 | S2 | S1 | PP | R1 | R2 | R3 |
|---|---|---|---|---|---|---|---|
| Standard | 42,633.51 | 54,715.41 | 75,594.23 | 87,676.13 | 108,554.95 | 120,636.85 | 141,515.67 |
| Camarilla | 87,408.84 | 90,430.24 | 93,451.64 | 96,473.04 | 99,494.44 | 102,515.84 | 105,537.24 |
| Woodie | 47,031.96 | 56,914.64 | 79,992.68 | 89,875.36 | 112,953.40 | 122,836.08 | 145,914.12 |
| Fibonacci | 54,715.41 | 67,306.41 | 75,085.14 | 87,676.13 | 100,267.13 | 108,045.86 | 120,636.85 |
Numerical data
The following is the status of technical indicators and moving averages registered at the time this technical analysis was created:
| RSI (14): | 48.04 | |
| MACD (12,26,9): | 131.2200 | |
| Directional Movement: | -7.54 | |
| AROON (14): | -42.86 | |
| DEMA (21): | 97,798.27 | |
| Parabolic SAR (0,02-0,02-0,2): | 99,217.65 | |
| Elder Ray (13): | -378.24 | |
| Super Trend (3,10): | 96,411.68 | |
| Zig ZAG (10): | 97,421.41 | |
| VORTEX (21): | 1.0600 | |
| Stochastique (14,3,5): | 22.12 | |
| TEMA (21): | 98,245.13 | |
| Williams %R (14): | -62.72 | |
| Chande Momentum Oscillator (20): | 216.73 | |
| Repulse (5,40,3): | 0.1000 | |
| ROCnROLL: | 2 | |
| TRIX (15,9): | 0.0400 | |
| Courbe Coppock: | 1.39 |
| MA7: | 101,354.90 | |
| MA20: | 99,799.17 | |
| MA50: | 92,420.86 | |
| MA100: | 78,533.55 | |
| MAexp7: | 97,747.33 | |
| MAexp20: | 97,638.18 | |
| MAexp50: | 98,149.16 | |
| MAexp100: | 99,577.84 | |
| Price / MA7: | -4.03% | |
| Price / MA20: | -2.54% | |
| Price / MA50: | +5.25% | |
| Price / MA100: | +23.86% | |
| Price / MAexp7: | -0.49% | |
| Price / MAexp20: | -0.38% | |
| Price / MAexp50: | -0.90% | |
| Price / MAexp100: | -2.32% |
About author

Online


Add a comment
Comments
0 comments on the analysis BITCOIN - BTC/USD - 1H