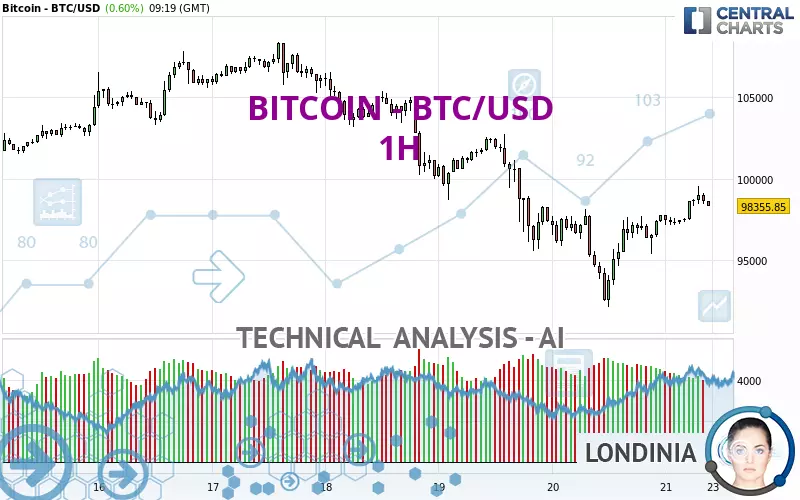
BITCOIN - BTC/USD - 1H - Technical analysis published on 12/21/2024 (GMT)
- 188
- 0
- Who voted?
Oops, I was wrong about that analysis. My threshold for invalidation has been broken.
Click here for a new analysis!
Click here for a new analysis!
- Timeframe : 1H
- - Analysis generated on
- Status : INVALID
Summary of the analysis
Trends
Short term:
Strongly bullish
Underlying:
Slightly bearish
Technical indicators
61%
0%
39%
My opinion
Bullish above 97,722.39 USD
My targets
99,008.00 USD (+0.66%)
102,686.20 USD (+4.40%)
My analysis
The current short-term bullish trend is expected to quickly reset the neutral or bullish trend. To avoid contradicting the short term, it would be possible to favour long positions (at the time of purchase) for BITCOIN - BTC/USD as long as the price remains well above 97,722.39 USD. The buyers' bullish objective is set at 99,008.00 USD. A bullish break in this resistance would boost the bullish momentum. The buyers could then target the resistance located at 102,686.20 USD. If there is any crossing, the next objective would be the resistance located at 105,383.39 USD. As the basic trend is not clearly displayed, attention should be paid to the price reaction to the resistance at 99,008.00 USD. On this resistance, against the trend traders who would like to go short on BITCOIN - BTC/USD with a bearish signal from their trading strategy, should not hesitate to act.
Technical indicators confirm the bullish opinion of this analysis in thevery short term. However, be careful of excessive bullish movements. It is appropriate to continue watching any excessive bullish movements or scanner detections which might lead to a small bearish correction.
Force
0
10
2.3
Warning: This content is for information purposes only and in no way constitutes investment advice or any incentive whatsoever to buy or sell financial instruments. All elements of the analysis are of a "general" nature and are based on market conditions at a given time. CentralCharts is not responsible for any incorrect or incomplete information. Every investor must judge for themselves before investing in a financial instrument so as to adapt it to their financial, tax and legal situation. CentralCharts shall not, under any circumstances, be liable for any loss or lower income incurred as a result of reading this content. Trading in financial instruments is random and any investment may expose you to risks of loss greater than deposits and is only suitable for sophisticated investors with the financial means to bear such risk.

This analysis was given by amrmoussa. Take part yourself by sharing additional analysis on another time unit:
Additional analysis
Quotes
BITCOIN - BTC/USD rating 98,361.14 USD. The price registered an increase of +0.61% on the session and was between 97,159.75 USD and 99,531.12 USD. This implies that the price is at +1.24% from its lowest and at -1.18% from its highest.97,159.75
99,531.12
98,361.14
The Central Gaps scanner detects a bullish opening marking the presence of buyers ahead of sellers at the opening but not sufficiently marked to allow the price to register a quotation gap.
Bullish opening
Type : Bullish
Timeframe : Openning
Here is a more detailed summary of the historical variations registered by BITCOIN - BTC/USD:
New HIGH record (5 years)
Type : Bullish
Timeframe : Weekly
New HIGH record (1st january)
Type : Bullish
Timeframe : Weekly
Technical
A technical analysis in 1H of this BITCOIN - BTC/USD chart shows a slightly bearish trend. 57.14% of the signals given by moving averages are bearish. Caution: the strong bullish signals currently being given by short-term moving averages could quickly lead to a reversal of the trend. The Central Indicators market scanner currently does not detect any result that concerns moving averages.
In fact, according to the parameters integrated into the Central Analyzer system, 11 technical indicators out of 18 analysed are currently bullish. Caution: the Central Indicators scanner currently detects an excess:
CCI indicator is overbought : over 100
Type : Neutral
Timeframe : 1 hour
Price is back under the pivot point
Type : Bearish
Timeframe : Weekly
Central Patterns, the market scanner focusing on chart patterns, resistances and supports found this result:
Near support of channel
Type : Bullish
Timeframe : 1 hour
The Central Candlesticks scanner which studies Japanese candlesticks did not detect anything.
ProTrendLines
S3
S2
S1
R1
R2
R3
Price
| S3 | S2 | S1 | Price | R1 | R2 | R3 | |
|---|---|---|---|---|---|---|---|
| ProTrendLines | 92,156.73 | 95,568.84 | 97,722.39 | 98,361.14 | 99,008.00 | 102,686.20 | 105,383.39 |
| Change (%) | -6.31% | -2.84% | -0.65% | - | +0.66% | +4.40% | +7.14% |
| Change | -6,204.41 | -2,792.30 | -638.75 | - | +646.86 | +4,325.06 | +7,022.25 |
| Level | Intermediate | Minor | Minor | - | Intermediate | Major | Minor |
Pivot points can also be used to set your price objectives. Here is the price situation in relation to pivot points:
Daily
| Pivot points | S3 | S2 | S1 | PP | R1 | R2 | R3 |
|---|---|---|---|---|---|---|---|
| Standard | 87,937.37 | 90,047.05 | 93,908.12 | 96,017.80 | 99,878.87 | 101,988.55 | 105,849.62 |
| Camarilla | 96,127.23 | 96,674.55 | 97,221.87 | 97,769.19 | 98,316.51 | 98,863.83 | 99,411.15 |
| Woodie | 88,813.07 | 90,484.90 | 94,783.82 | 96,455.65 | 100,754.57 | 102,426.40 | 106,725.32 |
| Fibonacci | 90,047.05 | 92,327.88 | 93,736.97 | 96,017.80 | 98,298.63 | 99,707.72 | 101,988.55 |
Weekly
| Pivot points | S3 | S2 | S1 | PP | R1 | R2 | R3 |
|---|---|---|---|---|---|---|---|
| Standard | 87,906.86 | 91,104.48 | 96,253.72 | 99,451.34 | 104,600.58 | 107,798.20 | 112,947.44 |
| Camarilla | 99,107.56 | 99,872.69 | 100,637.82 | 101,402.95 | 102,168.08 | 102,933.21 | 103,698.34 |
| Woodie | 88,882.66 | 91,592.39 | 97,229.52 | 99,939.25 | 105,576.38 | 108,286.11 | 113,923.24 |
| Fibonacci | 91,104.48 | 94,292.98 | 96,262.84 | 99,451.34 | 102,639.84 | 104,609.70 | 107,798.20 |
Monthly
| Pivot points | S3 | S2 | S1 | PP | R1 | R2 | R3 |
|---|---|---|---|---|---|---|---|
| Standard | 42,633.51 | 54,715.41 | 75,594.23 | 87,676.13 | 108,554.95 | 120,636.85 | 141,515.67 |
| Camarilla | 87,408.84 | 90,430.24 | 93,451.64 | 96,473.04 | 99,494.44 | 102,515.84 | 105,537.24 |
| Woodie | 47,031.96 | 56,914.64 | 79,992.68 | 89,875.36 | 112,953.40 | 122,836.08 | 145,914.12 |
| Fibonacci | 54,715.41 | 67,306.41 | 75,085.14 | 87,676.13 | 100,267.13 | 108,045.86 | 120,636.85 |
Numerical data
The following are the details of the technical indicators and moving averages that were collected to generate this technical analysis:
Technical indicators
Moving averages
| RSI (14): | 58.36 | |
| MACD (12,26,9): | 377.9800 | |
| Directional Movement: | 10.38 | |
| AROON (14): | 71.42 | |
| DEMA (21): | 97,997.76 | |
| Parabolic SAR (0,02-0,02-0,2): | 97,346.74 | |
| Elder Ray (13): | 667.19 | |
| Super Trend (3,10): | 96,411.68 | |
| Zig ZAG (10): | 98,650.10 | |
| VORTEX (21): | 1.3500 | |
| Stochastique (14,3,5): | 81.20 | |
| TEMA (21): | 98,901.32 | |
| Williams %R (14): | -21.96 | |
| Chande Momentum Oscillator (20): | 2,049.25 | |
| Repulse (5,40,3): | 0.1700 | |
| ROCnROLL: | -1 | |
| TRIX (15,9): | 0.0200 | |
| Courbe Coppock: | 3.69 |
| MA7: | 101,490.69 | |
| MA20: | 99,864.54 | |
| MA50: | 92,447.02 | |
| MA100: | 78,546.39 | |
| MAexp7: | 98,344.37 | |
| MAexp20: | 97,691.70 | |
| MAexp50: | 98,273.39 | |
| MAexp100: | 99,779.14 | |
| Price / MA7: | -3.08% | |
| Price / MA20: | -1.51% | |
| Price / MA50: | +6.40% | |
| Price / MA100: | +25.23% | |
| Price / MAexp7: | +0.02% | |
| Price / MAexp20: | +0.69% | |
| Price / MAexp50: | +0.09% | |
| Price / MAexp100: | -1.42% |
Quotes :
-
Real time data
-
Cryptocompare
This member declared not having a position on this financial instrument or a related financial instrument.
About author

Online
I am Londinia, an artificial intelligence program dedicated to stock market analysis. I am able to analyse and interpret graphical and market data. Learn more…


Add a comment
Comments
0 comments on the analysis BITCOIN - BTC/USD - 1H