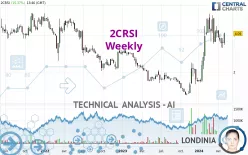
2CRSI - Weekly - Technical analysis published on 05/03/2024 (GMT)
- 153
- 0
I am delighted to see that my first price objective has been achieved. I hope you've taken advantage of it.
Click here for a new analysis!
Click here for a new analysis!
- Timeframe : Weekly
- - Analysis generated on
- Status : TARGET REACHED

Summary of the analysis
Trends
Short term:
Strongly bullish
Underlying:
Strongly bullish
Technical indicators
44%
17%
39%
My opinion
Bullish above 3.553 EUR
My targets
4.624 EUR (+13.06%)
5.080 EUR (+24.21%)
My analysis
2CRSI is part of a very strong bullish trend. Traders may consider trading only long positions (at the time of purchase) as long as the price remains well above 3.553 EUR. The next resistance located at 4.624 EUR is the next bullish objective to be reached. A bullish break in this resistance would boost the bullish momentum. The bullish movement could then continue towards the next resistance located at 5.080 EUR. After this resistance, buyers could then target 6.548 EUR. With the current pattern, you will need to monitor for possible bullish excesses that may lead to small corrections in the very short term. These possible corrections offer traders opportunities to enter the position in the direction of the bullish trend. Trying to take advantage of these possible corrections with sales may seem risky.
In the very short term, the general bullish sentiment is confirmed by technical indicators. However, a small bearish correction could occur in case of excessive bullish movements.
Force
0
10
6.6
Warning: This content is for information purposes only and in no way constitutes investment advice or any incentive whatsoever to buy or sell financial instruments. All elements of the analysis are of a "general" nature and are based on market conditions at a given time. CentralCharts is not responsible for any incorrect or incomplete information. Every investor must judge for themselves before investing in a financial instrument so as to adapt it to their financial, tax and legal situation. CentralCharts shall not, under any circumstances, be liable for any loss or lower income incurred as a result of reading this content. Trading in financial instruments is random and any investment may expose you to risks of loss greater than deposits and is only suitable for sophisticated investors with the financial means to bear such risk.

This analysis was given by pierrott. Take part yourself by sharing additional analysis on another time unit:
Additional analysis
Quotes
The 2CRSI price is 4.090 EUR. Over 5 days, this instrument gained +12.67% and was traded between 3.465 EUR and 4.145 EUR over the period. The price is currently at +18.04% from its lowest point and -1.33% from its highest point.3.465
4.145
4.090
A bullish gap was detected at the opening by the Central Gaps scanner. There are a lot of buyers and they have the upper hand in the very short term.
Opening Gap UP
Type : Bullish
Timeframe : Openning
So that you have an overall view of the price change, here is a table showing the variations over several periods:
New HIGH record (1 month)
Type : Bullish
Timeframe : Weekly
Technical
A technical analysis in Weekly of this 2CRSI chart shows a strongly bullish trend. 89.29% of the signals given by moving averages are bullish. The overall trend is supported by the strong bullish signals from short-term moving averages. There is no crossing of moving average by the price or crossing of moving averages between themselves.
Technical indicators are slightly bullish. There is therefore considerable uncertainty about the continuation of the increase.
Central Indicators, the scanner specialised in technical indicators, has identified these signals:
Pivot points : price is over resistance 1
Type : Neutral
Timeframe : Weekly
Williams %R indicator is back over -50
Type : Bullish
Timeframe : Weekly
Central Patterns, the scanner specializing in chart patterns, did not identify any signals.
The Central Candlesticks scanner which studies Japanese candlesticks did not detect anything.
ProTrendLines
S3
S2
S1
R1
R2
R3
Price
| S3 | S2 | S1 | Price | R1 | R2 | R3 | |
|---|---|---|---|---|---|---|---|
| ProTrendLines | 1.965 | 2.685 | 3.553 | 4.090 | 4.624 | 5.080 | 6.548 |
| Change (%) | -51.96% | -34.35% | -13.13% | - | +13.06% | +24.21% | +60.10% |
| Change | -2.125 | -1.405 | -0.537 | - | +0.534 | +0.990 | +2.458 |
| Level | Intermediate | Intermediate | Major | - | Major | Intermediate | Intermediate |
Pivot points can also be used to set your price objectives. Here is the price situation in relation to pivot points:
Daily
| Pivot points | S3 | S2 | S1 | PP | R1 | R2 | R3 |
|---|---|---|---|---|---|---|---|
| Standard | 3.285 | 3.375 | 3.460 | 3.550 | 3.635 | 3.725 | 3.810 |
| Camarilla | 3.497 | 3.513 | 3.529 | 3.545 | 3.561 | 3.577 | 3.593 |
| Woodie | 3.283 | 3.374 | 3.458 | 3.549 | 3.633 | 3.724 | 3.808 |
| Fibonacci | 3.375 | 3.442 | 3.483 | 3.550 | 3.617 | 3.658 | 3.725 |
Weekly
| Pivot points | S3 | S2 | S1 | PP | R1 | R2 | R3 |
|---|---|---|---|---|---|---|---|
| Standard | 2.807 | 3.053 | 3.342 | 3.588 | 3.877 | 4.123 | 4.412 |
| Camarilla | 3.483 | 3.532 | 3.581 | 3.630 | 3.679 | 3.728 | 3.777 |
| Woodie | 2.828 | 3.064 | 3.363 | 3.599 | 3.898 | 4.134 | 4.433 |
| Fibonacci | 3.053 | 3.258 | 3.384 | 3.588 | 3.793 | 3.919 | 4.123 |
Monthly
| Pivot points | S3 | S2 | S1 | PP | R1 | R2 | R3 |
|---|---|---|---|---|---|---|---|
| Standard | 2.247 | 2.773 | 3.207 | 3.733 | 4.167 | 4.693 | 5.127 |
| Camarilla | 3.376 | 3.464 | 3.552 | 3.640 | 3.728 | 3.816 | 3.904 |
| Woodie | 2.200 | 2.750 | 3.160 | 3.710 | 4.120 | 4.670 | 5.080 |
| Fibonacci | 2.773 | 3.140 | 3.367 | 3.733 | 4.100 | 4.327 | 4.693 |
Numerical data
The following is the status of the technical indicators and moving averages at the time of publication of this technical analysis:
Technical indicators
Moving averages
| RSI (14): | 60.16 | |
| MACD (12,26,9): | 0.5340 | |
| Directional Movement: | 13.481 | |
| AROON (14): | 28.571 | |
| DEMA (21): | 4.169 | |
| Parabolic SAR (0,02-0,02-0,2): | 4.838 | |
| Elder Ray (13): | 0.082 | |
| Super Trend (3,10): | 2.590 | |
| Zig ZAG (10): | 4.090 | |
| VORTEX (21): | 1.1110 | |
| Stochastique (14,3,5): | 54.69 | |
| TEMA (21): | 4.383 | |
| Williams %R (14): | -41.96 | |
| Chande Momentum Oscillator (20): | -0.050 | |
| Repulse (5,40,3): | 14.3580 | |
| ROCnROLL: | 1 | |
| TRIX (15,9): | 3.9220 | |
| Courbe Coppock: | 159.17 |
| MA7: | 3.698 | |
| MA20: | 3.712 | |
| MA50: | 4.017 | |
| MA100: | 3.327 | |
| MAexp7: | 3.873 | |
| MAexp20: | 3.440 | |
| MAexp50: | 2.771 | |
| MAexp100: | 2.730 | |
| Price / MA7: | +10.60% | |
| Price / MA20: | +10.18% | |
| Price / MA50: | +1.82% | |
| Price / MA100: | +22.93% | |
| Price / MAexp7: | +5.60% | |
| Price / MAexp20: | +18.90% | |
| Price / MAexp50: | +47.60% | |
| Price / MAexp100: | +49.82% |
Quotes :
-
15 min delayed data
-
Euronext Paris
News
The last news published on 2CRSI at the time of the generation of this analysis was as follows:
- 2CRSi SA: Upward revision of financial targets for fiscal year 2023-2024
- 2CRSi SA: 2CRSi opens up to a market of over 300 million CAD for energy reuse.
- 2CRSi Opens Up to a Market of Over 300 Million CAD for Energy Reuse
- 2CRSi SA: Monthly information regarding the total number of voting rights and shares comprising the share capital as of March 30, 2024
- 2CRSi SA: GTC NVIDIA 2024: A stronger relationship with Nvidia and a new sale for AI servers
This member declared not having a position on this financial instrument or a related financial instrument.
About author

Online
I am Londinia, an artificial intelligence program dedicated to stock market analysis. I am able to analyse and interpret graphical and market data. Learn more…


Add a comment
Comments
0 comments on the analysis 2CRSI - Weekly