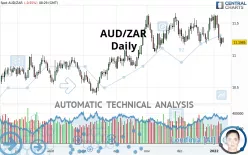
AUD/ZAR - Daily - Technical analysis published on 01/11/2022 (GMT)
- 263
- 0
Click here for a new analysis!
- Timeframe : Daily
- - Analysis generated on
- Status : TARGET REACHED

Summary of the analysis

Additional analysis
Quotes
The AUD/ZAR rating is 11.1986 ZAR. The price registered a decrease of -0.55% on the session and was between 11.1868 ZAR and 11.2779 ZAR. This implies that the price is at +0.11% from its lowest and at -0.70% from its highest.A bullish opening was detected by the Central Gaps scanner. Buyers are trying to impose a bullish momentum in the very short term.
Bullish opening
Type : Bullish
Timeframe : Openning
So that you have an overall view of the price change, here is a table showing the variations over several periods:
Technical
Technical analysis of this Daily chart of AUD/ZAR indicates that the overall trend is not clearly defined. The trend could quickly turn bearish due to the strong bearish signals currently being given by short-term moving averages. An assessment of moving averages reveals a bearish signal that could impact this trend:
Bearish price crossover with adaptative moving average 50
Type : Bearish
Timeframe : Daily
The probability of a further decline is moderate given the direction of the technical indicators.
Caution: the Central Indicators scanner currently detects an excess:
Williams %R indicator is oversold : under -80
Type : Neutral
Timeframe : Daily
Ichimoku : price is under the cloud
Type : Bearish
Timeframe : Daily
Price is back under the pivot point
Type : Bearish
Timeframe : Daily
The Central Patterns scanner, which studies chart patterns, resistances and supports, has identified this signal:
Near support of channel
Type : Bullish
Timeframe : Daily
The Central Candlesticks scanner, specialised in Japanese candlesticks, did not identify any signals.
| S3 | S2 | S1 | Price | R1 | R2 | R3 | |
|---|---|---|---|---|---|---|---|
| ProTrendLines | 10.4071 | 10.6360 | 11.0538 | 11.1986 | 11.2170 | 11.3324 | 11.4638 |
| Change (%) | -7.07% | -5.02% | -1.29% | - | +0.16% | +1.19% | +2.37% |
| Change | -0.7915 | -0.5626 | -0.1448 | - | +0.0184 | +0.1338 | +0.2652 |
| Level | Major | Minor | Major | - | Major | Minor | Intermediate |
Pivot points can also be used to set your price objectives. Here is the price situation in relation to pivot points:
| Pivot points | S3 | S2 | S1 | PP | R1 | R2 | R3 |
|---|---|---|---|---|---|---|---|
| Standard | 11.0756 | 11.1221 | 11.1913 | 11.2378 | 11.3070 | 11.3535 | 11.4227 |
| Camarilla | 11.2286 | 11.2392 | 11.2498 | 11.2604 | 11.2710 | 11.2816 | 11.2922 |
| Woodie | 11.0869 | 11.1278 | 11.2026 | 11.2435 | 11.3183 | 11.3592 | 11.4340 |
| Fibonacci | 11.1221 | 11.1663 | 11.1936 | 11.2378 | 11.2820 | 11.3093 | 11.3535 |
| Pivot points | S3 | S2 | S1 | PP | R1 | R2 | R3 |
|---|---|---|---|---|---|---|---|
| Standard | 10.4999 | 10.8172 | 11.0006 | 11.3179 | 11.5013 | 11.8186 | 12.0020 |
| Camarilla | 11.0462 | 11.0921 | 11.1380 | 11.1839 | 11.2298 | 11.2757 | 11.3216 |
| Woodie | 10.4329 | 10.7837 | 10.9336 | 11.2844 | 11.4343 | 11.7851 | 11.9350 |
| Fibonacci | 10.8172 | 11.0085 | 11.1267 | 11.3179 | 11.5092 | 11.6274 | 11.8186 |
| Pivot points | S3 | S2 | S1 | PP | R1 | R2 | R3 |
|---|---|---|---|---|---|---|---|
| Standard | 10.8211 | 10.9909 | 11.2908 | 11.4606 | 11.7605 | 11.9303 | 12.2302 |
| Camarilla | 11.4616 | 11.5047 | 11.5477 | 11.5908 | 11.6339 | 11.6769 | 11.7200 |
| Woodie | 10.8863 | 11.0234 | 11.3560 | 11.4931 | 11.8257 | 11.9628 | 12.2954 |
| Fibonacci | 10.9909 | 11.1703 | 11.2811 | 11.4606 | 11.6400 | 11.7508 | 11.9303 |
Numerical data
The following is the status of technical indicators and moving averages registered at the time this technical analysis was created:
| RSI (14): | 43.77 | |
| MACD (12,26,9): | -0.0131 | |
| Directional Movement: | -8.2127 | |
| AROON (14): | -28.5714 | |
| DEMA (21): | 11.3559 | |
| Parabolic SAR (0,02-0,02-0,2): | 11.5885 | |
| Elder Ray (13): | -0.1087 | |
| Super Trend (3,10): | 11.1268 | |
| Zig ZAG (10): | 11.1997 | |
| VORTEX (21): | 0.9620 | |
| Stochastique (14,3,5): | 16.09 | |
| TEMA (21): | 11.3076 | |
| Williams %R (14): | -86.94 | |
| Chande Momentum Oscillator (20): | -0.0539 | |
| Repulse (5,40,3): | -1.4247 | |
| ROCnROLL: | 2 | |
| TRIX (15,9): | 0.0200 | |
| Courbe Coppock: | 0.15 |
| MA7: | 11.3461 | |
| MA20: | 11.3723 | |
| MA50: | 11.3481 | |
| MA100: | 11.1023 | |
| MAexp7: | 11.3071 | |
| MAexp20: | 11.3590 | |
| MAexp50: | 11.3078 | |
| MAexp100: | 11.1978 | |
| Price / MA7: | -1.30% | |
| Price / MA20: | -1.53% | |
| Price / MA50: | -1.32% | |
| Price / MA100: | +0.87% | |
| Price / MAexp7: | -0.96% | |
| Price / MAexp20: | -1.41% | |
| Price / MAexp50: | -0.97% | |
| Price / MAexp100: | +0.01% |
About author

Online


Add a comment
Comments
0 comments on the analysis AUD/ZAR - Daily