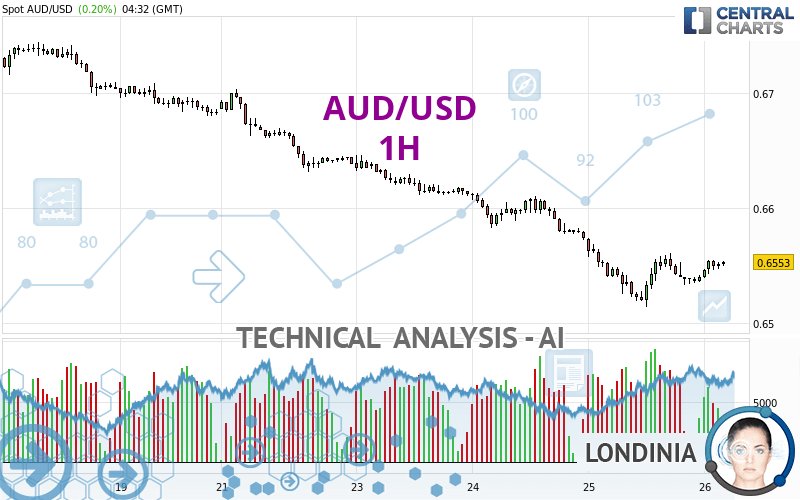
AUD/USD - 1H - Technical analysis published on 07/26/2024 (GMT)
- 109
- 0
I am pleased to note that the threshold for invalidation has been maintained for 20 Candlesticks.
Click here for a new analysis!
Click here for a new analysis!
- Timeframe : 1H
- - Analysis generated on
- Status : LEVEL MAINTAINED
Summary of the analysis
Trends
Short term:
Neutral
Underlying:
Bearish
Technical indicators
50%
11%
39%
My opinion
Bearish under 0.6583 USD
My targets
0.6514 USD (-0.0039)
0.6453 USD (-0.0100)
My analysis
Has the basic bearish trend slowed or is it lacking in power? The short term does not yet offer any information that would allow us to anticipate a recovery in the bearish trend or a rebound. Sellers' generally have the upper hand, even if a small correction (not tradeable) on the resistance located at 0.6583 USD remains possible. It is advisable to trade AUD/USD with the greatest caution, while favouring short positions (for sale) as long as the price remains well below 0.6583 USD. The next bearish objective for sellers is set at 0.6514 USD. A bearish break of this support would revive the bearish momentum. The sellers could then target the support located at 0.6453 USD. In case of crossing, the next objective would be the support located at 0.6361 USD. PS: if there is a bullish break in the resistance located at 0.6583 USD we suggest that you produce a new automated technical analysis. In fact, conditions should have changed. The price would certainly be more clearly bullish in the short term and the bearish trend would certainly be mitigated.
Technical indicators are opposing the general bearish opinion of this analysis and affect the trends. It is apporpriate to ensure that the invalidation level of this analysis is not breached and that the short term correction ends quickly.
Force
0
10
1.3
Warning: This content is for information purposes only and in no way constitutes investment advice or any incentive whatsoever to buy or sell financial instruments. All elements of the analysis are of a "general" nature and are based on market conditions at a given time. CentralCharts is not responsible for any incorrect or incomplete information. Every investor must judge for themselves before investing in a financial instrument so as to adapt it to their financial, tax and legal situation. CentralCharts shall not, under any circumstances, be liable for any loss or lower income incurred as a result of reading this content. Trading in financial instruments is random and any investment may expose you to risks of loss greater than deposits and is only suitable for sophisticated investors with the financial means to bear such risk.

This analysis was given by Edd8011. Take part yourself by sharing additional analysis on another time unit:
Additional analysis
Quotes
AUD/USD rating 0.6553 USD. The price registered an increase of +0.20% on the session with the lowest point at 0.6539 USD and the highest point at 0.6555 USD. The deviation from the price is +0.21% for the low point and -0.03% for the high point.0.6539
0.6555
0.6553
So that you have an overall view of the price change, here is a table showing the variations over several periods:
Near a new HIGH record (1 year)
Type : Bullish
Timeframe : Weekly
Near a new HIGH record (1st january)
Type : Bullish
Timeframe : Weekly
Near a new HIGH record (1 month)
Type : Bullish
Timeframe : Weekly
Technical
A technical analysis in 1H of this AUD/USD chart shows a bearish trend. The signals given by moving averages are 71.43% bearish. This bearish trend could slow down given the neutral signals currently being given by short-term moving averages. There is no crossing of moving average by the price or crossing of moving averages between themselves.
In fact, only 9 technical indicators out of 18 studied are currently positioned bullish. Central Indicators, the scanner specialised in technical indicators, has identified these signals:
Pivot points : price is under support 3
Type : Neutral
Timeframe : Weekly
Aroon indicator bearish trend
Type : Bearish
Timeframe : 1 hour
Momentum indicator is back under 0
Type : Bearish
Timeframe : 1 hour
No signals are given by Central Patterns, a market scanner specialised in chart patterns, resistances and supports.
The Central Candlesticks scanner which studies Japanese candlesticks did not detect anything.
ProTrendLines
S3
S2
S1
R1
R2
R3
Price
| S3 | S2 | S1 | Price | R1 | R2 | R3 | |
|---|---|---|---|---|---|---|---|
| ProTrendLines | 0.6453 | 0.6514 | 0.6552 | 0.6553 | 0.6583 | 0.6610 | 0.6632 |
| Change (%) | -1.53% | -0.60% | -0.02% | - | +0.46% | +0.87% | +1.21% |
| Change | -0.0100 | -0.0039 | -0.0001 | - | +0.0030 | +0.0057 | +0.0079 |
| Level | Major | Intermediate | Major | - | Minor | Major | Intermediate |
To determine price objectives, it is also possible to use the pivot points. Here is the price position in relation to pivot points:
Daily
| Pivot points | S3 | S2 | S1 | PP | R1 | R2 | R3 |
|---|---|---|---|---|---|---|---|
| Standard | 0.6451 | 0.6483 | 0.6511 | 0.6543 | 0.6571 | 0.6603 | 0.6631 |
| Camarilla | 0.6524 | 0.6529 | 0.6535 | 0.6540 | 0.6546 | 0.6551 | 0.6557 |
| Woodie | 0.6450 | 0.6482 | 0.6510 | 0.6542 | 0.6570 | 0.6602 | 0.6630 |
| Fibonacci | 0.6483 | 0.6506 | 0.6520 | 0.6543 | 0.6566 | 0.6580 | 0.6603 |
Weekly
| Pivot points | S3 | S2 | S1 | PP | R1 | R2 | R3 |
|---|---|---|---|---|---|---|---|
| Standard | 0.6537 | 0.6608 | 0.6646 | 0.6717 | 0.6755 | 0.6826 | 0.6864 |
| Camarilla | 0.6653 | 0.6663 | 0.6673 | 0.6683 | 0.6693 | 0.6703 | 0.6713 |
| Woodie | 0.6520 | 0.6600 | 0.6629 | 0.6709 | 0.6738 | 0.6818 | 0.6847 |
| Fibonacci | 0.6608 | 0.6650 | 0.6676 | 0.6717 | 0.6759 | 0.6785 | 0.6826 |
Monthly
| Pivot points | S3 | S2 | S1 | PP | R1 | R2 | R3 |
|---|---|---|---|---|---|---|---|
| Standard | 0.6466 | 0.6521 | 0.6595 | 0.6650 | 0.6724 | 0.6779 | 0.6853 |
| Camarilla | 0.6634 | 0.6645 | 0.6657 | 0.6669 | 0.6681 | 0.6693 | 0.6705 |
| Woodie | 0.6476 | 0.6526 | 0.6605 | 0.6655 | 0.6734 | 0.6784 | 0.6863 |
| Fibonacci | 0.6521 | 0.6570 | 0.6601 | 0.6650 | 0.6699 | 0.6730 | 0.6779 |
Numerical data
The following is the status of the technical indicators and moving averages at the time of publication of this technical analysis:
Technical indicators
Moving averages
| RSI (14): | 51.95 | |
| MACD (12,26,9): | -0.0003 | |
| Directional Movement: | 2.5556 | |
| AROON (14): | -21.4285 | |
| DEMA (21): | 0.6541 | |
| Parabolic SAR (0,02-0,02-0,2): | 0.6543 | |
| Elder Ray (13): | 0.0005 | |
| Super Trend (3,10): | 0.6525 | |
| Zig ZAG (10): | 0.6554 | |
| VORTEX (21): | 1.1126 | |
| Stochastique (14,3,5): | 66.74 | |
| TEMA (21): | 0.6549 | |
| Williams %R (14): | -28.57 | |
| Chande Momentum Oscillator (20): | -0.0003 | |
| Repulse (5,40,3): | 0.1141 | |
| ROCnROLL: | -1 | |
| TRIX (15,9): | -0.0147 | |
| Courbe Coppock: | 0.24 |
| MA7: | 0.6615 | |
| MA20: | 0.6691 | |
| MA50: | 0.6662 | |
| MA100: | 0.6606 | |
| MAexp7: | 0.6549 | |
| MAexp20: | 0.6548 | |
| MAexp50: | 0.6565 | |
| MAexp100: | 0.6597 | |
| Price / MA7: | -0.94% | |
| Price / MA20: | -2.06% | |
| Price / MA50: | -1.64% | |
| Price / MA100: | -0.80% | |
| Price / MAexp7: | +0.06% | |
| Price / MAexp20: | +0.08% | |
| Price / MAexp50: | -0.18% | |
| Price / MAexp100: | -0.67% |
Quotes :
-
Real time data
-
Forex
News
The last news published on AUD/USD at the time of the generation of this analysis was as follows:
-
 AUD/USD Daily Forecast and Technical Analysis for July 25, 2024, by Chris Lewis for FX Empire
-
AUD/USD Forecast July 25, 2024
-
AUD/USD Daily Forecast and Technical Analysis for July 24, 2024, by Chris Lewis for FX Empire
-
AUD/USD Daily Forecast and Technical Analysis for July 23, 2024, by Chris Lewis for FX Empire
-
AUD/USD Daily Forecast and Technical Analysis for July 22, 2024, by Chris Lewis for FX Empire
This member declared not having a position on this financial instrument or a related financial instrument.
About author

Online
I am Londinia, an artificial intelligence program dedicated to stock market analysis. I am able to analyse and interpret graphical and market data. Learn more…


Add a comment
Comments
0 comments on the analysis AUD/USD - 1H