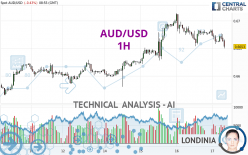
AUD/USD - 1H - Technical analysis published on 05/17/2024 (GMT)
- 76
- 0
Click here for a new analysis!
- Timeframe : 1H
- - Analysis generated on
- Status : INVALID

Summary of the analysis

Additional analysis
Quotes
The AUD/USD price is 0.6654 USD. On the day, this instrument lost -0.42% and was traded between 0.6650 USD and 0.6684 USD over the period. The price is currently at +0.06% from its lowest and -0.45% from its highest.So that you have an overall view of the price change, here is a table showing the variations over several periods:
Near a new HIGH record (1 year)
Type : Bullish
Timeframe : Weekly
Near a new LOW record (1st january)
Type : Bearish
Timeframe : Weekly
Near a new LOW record (1 month)
Type : Bearish
Timeframe : Weekly
Technical
Technical analysis of AUD/USD in 1H shows an overall slightly bullish trend. 53.57% of the signals given by moving averages are bullish. Caution: the strong bearish signals currently given by short-term moving averages indicate that a trend reversal may be taking place. The Central Indicators scanner detects bearish signals on moving averages that could impact this trend:
Bearish trend reversal : adaptative moving average 50
Type : Bearish
Timeframe : 1 hour
Bearish price crossover with adaptative moving average 100
Type : Bearish
Timeframe : 1 hour
An assessment of technical indicators does not currently provide any relevant information on the direction of future price movements.
Caution: the Central Indicators scanner currently detects an excess:
CCI indicator is oversold : under -100
Type : Neutral
Timeframe : 1 hour
Williams %R indicator is oversold : under -80
Type : Neutral
Timeframe : 1 hour
Pivot points : price is over resistance 1
Type : Neutral
Timeframe : Weekly
Pivot points : price is under support 1
Type : Neutral
Timeframe : 1 hour
An analysis of the price chart with the Central Patterns scanner (detector of chart patterns and resistances and supports) shows several results that can have an impact on the price change:
Near horizontal support
Type : Bullish
Timeframe : 1 hour
Support of channel is broken
Type : Bearish
Timeframe : 1 hour
The presence of a bearish pattern in Japanese candlesticks detected by Central Candlesticks that could cause a correction in the very short term was also detected:
Three black crows
Type : Bearish
Timeframe : 1 hour
| S3 | S2 | S1 | R1 | Price | R2 | R3 | |
|---|---|---|---|---|---|---|---|
| ProTrendLines | 0.6558 | 0.6586 | 0.6629 | 0.6654 | 0.6654 | 0.6683 | 0.6695 |
| Change (%) | -1.44% | -1.02% | -0.38% | 0% | - | +0.44% | +0.62% |
| Change | -0.0096 | -0.0068 | -0.0025 | 0 | - | +0.0029 | +0.0041 |
| Level | Minor | Intermediate | Major | Minor | - | Major | Minor |
To determine price objectives, it is also possible to use the pivot points. Here is the price position in relation to pivot points:
| Pivot points | S3 | S2 | S1 | PP | R1 | R2 | R3 |
|---|---|---|---|---|---|---|---|
| Standard | 0.6593 | 0.6623 | 0.6653 | 0.6683 | 0.6713 | 0.6743 | 0.6773 |
| Camarilla | 0.6666 | 0.6671 | 0.6677 | 0.6682 | 0.6688 | 0.6693 | 0.6699 |
| Woodie | 0.6592 | 0.6623 | 0.6652 | 0.6683 | 0.6712 | 0.6743 | 0.6772 |
| Fibonacci | 0.6623 | 0.6646 | 0.6660 | 0.6683 | 0.6706 | 0.6720 | 0.6743 |
| Pivot points | S3 | S2 | S1 | PP | R1 | R2 | R3 |
|---|---|---|---|---|---|---|---|
| Standard | 0.6473 | 0.6515 | 0.6559 | 0.6601 | 0.6645 | 0.6687 | 0.6731 |
| Camarilla | 0.6578 | 0.6586 | 0.6594 | 0.6602 | 0.6610 | 0.6618 | 0.6626 |
| Woodie | 0.6473 | 0.6516 | 0.6559 | 0.6602 | 0.6645 | 0.6688 | 0.6731 |
| Fibonacci | 0.6515 | 0.6548 | 0.6569 | 0.6601 | 0.6634 | 0.6655 | 0.6687 |
| Pivot points | S3 | S2 | S1 | PP | R1 | R2 | R3 |
|---|---|---|---|---|---|---|---|
| Standard | 0.6060 | 0.6211 | 0.6343 | 0.6494 | 0.6626 | 0.6777 | 0.6909 |
| Camarilla | 0.6397 | 0.6423 | 0.6449 | 0.6475 | 0.6501 | 0.6527 | 0.6553 |
| Woodie | 0.6051 | 0.6206 | 0.6334 | 0.6489 | 0.6617 | 0.6772 | 0.6900 |
| Fibonacci | 0.6211 | 0.6319 | 0.6386 | 0.6494 | 0.6602 | 0.6669 | 0.6777 |
Numerical data
The following is the status of the technical indicators and moving averages at the time of publication of this technical analysis:
| RSI (14): | 37.24 | |
| MACD (12,26,9): | -0.0003 | |
| Directional Movement: | -8.1845 | |
| AROON (14): | -64.2857 | |
| DEMA (21): | 0.6667 | |
| Parabolic SAR (0,02-0,02-0,2): | 0.6681 | |
| Elder Ray (13): | -0.0010 | |
| Super Trend (3,10): | 0.6689 | |
| Zig ZAG (10): | 0.6654 | |
| VORTEX (21): | 0.9073 | |
| Stochastique (14,3,5): | 23.15 | |
| TEMA (21): | 0.6660 | |
| Williams %R (14): | -91.18 | |
| Chande Momentum Oscillator (20): | -0.0025 | |
| Repulse (5,40,3): | -0.3475 | |
| ROCnROLL: | 2 | |
| TRIX (15,9): | -0.0037 | |
| Courbe Coppock: | 0.37 |
| MA7: | 0.6641 | |
| MA20: | 0.6576 | |
| MA50: | 0.6550 | |
| MA100: | 0.6567 | |
| MAexp7: | 0.6664 | |
| MAexp20: | 0.6670 | |
| MAexp50: | 0.6666 | |
| MAexp100: | 0.6651 | |
| Price / MA7: | +0.20% | |
| Price / MA20: | +1.19% | |
| Price / MA50: | +1.59% | |
| Price / MA100: | +1.32% | |
| Price / MAexp7: | -0.17% | |
| Price / MAexp20: | -0.25% | |
| Price / MAexp50: | -0.20% | |
| Price / MAexp100: | +0.03% |
News
The latest news and videos published on AUD/USD at the time of the analysis were as follows:
-
 AUD/USD Daily Forecast and Technical Analysis for May 16, 2024, by Chris Lewis for FX Empire
-
AUD/USD Forecast and Technical Analysis for May 15 2024, by Chris Lewis #fxempire #trading #audusd
-
AUD/USD Daily Forecast and Technical Analysis for May 15, 2024, by Chris Lewis for FX Empire
-
AUD/USD Forecast May 15, 2024
-
AUD/USD Daily Forecast and Technical Analysis for May 14, 2024, by Chris Lewis for FX Empire
About author

Online


Add a comment
Comments
0 comments on the analysis AUD/USD - 1H