AUD/USD - Daily - Technical analysis published on 11/18/2023 (GMT)
- 185
- 0
Click here for a new analysis!
- Timeframe : Daily
- - Analysis generated on
- Status : TARGET REACHED

Summary of the analysis

Additional analysis
Quotes
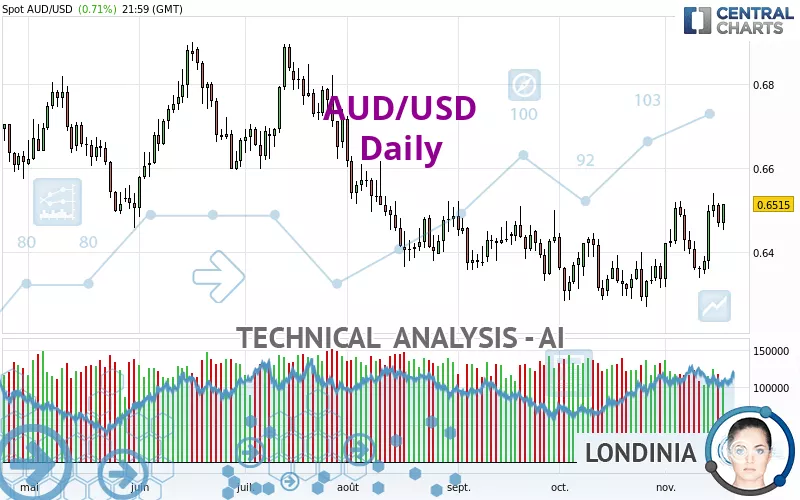
AUD/USD rating 0.6515 USD. The price registered an increase of +0.71% on the session and was between 0.6452 USD and 0.6516 USD. This implies that the price is at +0.98% from its lowest and at -0.02% from its highest.A study of price movements over other periods shows the following variations:
Near a new LOW record (1 year)
Type : Bearish
Timeframe : Weekly
Near a new LOW record (1st january)
Type : Bearish
Timeframe : Weekly
Near a new LOW record (1 month)
Type : Bearish
Timeframe : Weekly
Technical
Technical analysis of this Daily chart of AUD/USD indicates that the overall trend is bullish. The signals returned by the moving averages are 67.86% bullish. This bullish trend is reinforced by the strong signals currently being given by short-term moving averages. The Central Indicators market scanner is currently detecting several bullish signals that could impact this trend:
Bullish price crossover with Moving Average 100
Type : Bullish
Timeframe : Daily
Bullish price crossover with adaptative moving average 100
Type : Bullish
Timeframe : Daily
In fact, 15 technical indicators on 18 studied are currently bullish. Caution: the Central Indicators scanner currently detects an excess:
CCI indicator is overbought : over 100
Type : Neutral
Timeframe : Daily
Williams %R indicator is overbought : over -20
Type : Neutral
Timeframe : Daily
Pivot points : price is over resistance 1
Type : Neutral
Timeframe : Daily
Pivot points : price is over resistance 1
Type : Neutral
Timeframe : Weekly
Ichimoku : price is over the cloud
Type : Bullish
Timeframe : Daily
Central Patterns, the market scanner focusing on chart patterns, resistances and supports found this result:
Near resistance of channel
Type : Bearish
Timeframe : Daily
The Central Candlesticks scanner, specialised in Japanese candlesticks, did not identify any signals.
| S3 | S2 | S1 | Price | R1 | R2 | R3 | |
|---|---|---|---|---|---|---|---|
| ProTrendLines | 0.6374 | 0.6434 | 0.6498 | 0.6515 | 0.6576 | 0.6648 | 0.6784 |
| Change (%) | -2.16% | -1.24% | -0.26% | - | +0.94% | +2.04% | +4.13% |
| Change | -0.0141 | -0.0081 | -0.0017 | - | +0.0061 | +0.0133 | +0.0269 |
| Level | Intermediate | Minor | Major | - | Minor | Minor | Major |
Pivot points can also be used to set your price objectives. Here is the price situation in relation to pivot points:
| Pivot points | S3 | S2 | S1 | PP | R1 | R2 | R3 |
|---|---|---|---|---|---|---|---|
| Standard | 0.6409 | 0.6430 | 0.6473 | 0.6494 | 0.6537 | 0.6558 | 0.6601 |
| Camarilla | 0.6497 | 0.6503 | 0.6509 | 0.6515 | 0.6521 | 0.6527 | 0.6533 |
| Woodie | 0.6419 | 0.6436 | 0.6483 | 0.6500 | 0.6547 | 0.6564 | 0.6611 |
| Fibonacci | 0.6430 | 0.6455 | 0.6470 | 0.6494 | 0.6519 | 0.6534 | 0.6558 |
| Pivot points | S3 | S2 | S1 | PP | R1 | R2 | R3 |
|---|---|---|---|---|---|---|---|
| Standard | 0.6202 | 0.6276 | 0.6395 | 0.6469 | 0.6588 | 0.6662 | 0.6781 |
| Camarilla | 0.6462 | 0.6480 | 0.6497 | 0.6515 | 0.6533 | 0.6550 | 0.6568 |
| Woodie | 0.6226 | 0.6287 | 0.6419 | 0.6480 | 0.6612 | 0.6673 | 0.6805 |
| Fibonacci | 0.6276 | 0.6349 | 0.6395 | 0.6469 | 0.6542 | 0.6588 | 0.6662 |
| Pivot points | S3 | S2 | S1 | PP | R1 | R2 | R3 |
|---|---|---|---|---|---|---|---|
| Standard | 0.6081 | 0.6176 | 0.6256 | 0.6351 | 0.6431 | 0.6526 | 0.6606 |
| Camarilla | 0.6289 | 0.6305 | 0.6321 | 0.6337 | 0.6353 | 0.6369 | 0.6385 |
| Woodie | 0.6075 | 0.6172 | 0.6250 | 0.6347 | 0.6425 | 0.6522 | 0.6600 |
| Fibonacci | 0.6176 | 0.6243 | 0.6284 | 0.6351 | 0.6418 | 0.6459 | 0.6526 |
Numerical data
The following is the status of technical indicators and moving averages registered at the time this technical analysis was created:
| RSI (14): | 60.12 | |
| MACD (12,26,9): | 0.0027 | |
| Directional Movement: | 9.3025 | |
| AROON (14): | 78.5714 | |
| DEMA (21): | 0.6453 | |
| Parabolic SAR (0,02-0,02-0,2): | 0.6346 | |
| Elder Ray (13): | 0.0043 | |
| Super Trend (3,10): | 0.6312 | |
| Zig ZAG (10): | 0.6515 | |
| VORTEX (21): | 1.1129 | |
| Stochastique (14,3,5): | 80.99 | |
| TEMA (21): | 0.6485 | |
| Williams %R (14): | -11.84 | |
| Chande Momentum Oscillator (20): | 0.0092 | |
| Repulse (5,40,3): | 1.2875 | |
| ROCnROLL: | 1 | |
| TRIX (15,9): | 0.0338 | |
| Courbe Coppock: | 3.25 |
| MA7: | 0.6442 | |
| MA20: | 0.6407 | |
| MA50: | 0.6396 | |
| MA100: | 0.6488 | |
| MAexp7: | 0.6465 | |
| MAexp20: | 0.6424 | |
| MAexp50: | 0.6421 | |
| MAexp100: | 0.6476 | |
| Price / MA7: | +1.13% | |
| Price / MA20: | +1.69% | |
| Price / MA50: | +1.86% | |
| Price / MA100: | +0.42% | |
| Price / MAexp7: | +0.77% | |
| Price / MAexp20: | +1.42% | |
| Price / MAexp50: | +1.46% | |
| Price / MAexp100: | +0.60% |
News
The last news published on AUD/USD at the time of the generation of this analysis was as follows:
-
 AUD/USD Technical Analysis for the Week of November 20, 2023 by FXEmpire
-
AUD/USD Forecast for November 20, 2023 by FXEmpire
-
AUD/USD Forecast for November 17, 2023 by FXEmpire
-
Technical Analysis: 16/11/2023 - AUDUSD pulls back from a 3-month high
-
AUD/USD Forecast for November 16, 2023 by FXEmpire
About author

Online


Add a comment
Comments
0 comments on the analysis AUD/USD - Daily