AUD/USD
16.75
USD
(-2.56%)
03/12/2025 - 15:38
Closed Real time data - Forex
| Open: | 16.62 |
| Change: | -0.44 |
| Volume: | 90 |
| Low: | 16.56 |
| High: | 17.20 |
| High / Low range: | 0.64 |
| Type: | Forex |
| Ticker: | AUDUSD |
| ISIN: |
AUD/USD - AUD/USD Struggles Within a Narrow Range 0.7550 - 0.7640 - 12/04/2017 (GMT)
- 741
- 0
- 12/04/2017 - 09:27
- Who voted?
- Timeframe : Daily
AUD/USD Chart
Are you looking for opportunities in indices and forex?
DISCOVER LONDINIA OPPORTUNITIES...
DISCOVER LONDINIA OPPORTUNITIES...
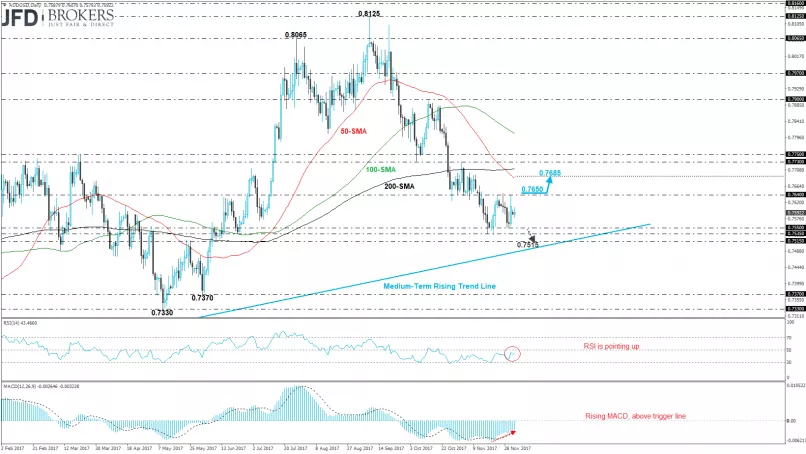
The AUD/USD pair is holding within the 50 and 100 SMAs on the weekly timeframe and the pressure is bigger for the price for having a strong tendency. Over the last two weeks, the commodity currency pair failed to create a significant movement and is also developing within the 0.7550 support level and the 0.7640 resistance handle.If the price jumps above the latter level, it will open the way for the 50-day SMA near 0.7685. On the other hand, a drop below 0.7550 will drive the pair towards the medium-term uptrend line neat 0.7515. The RSI indicator is sloping to the upside in the negative territory and the MACD oscillator is rising in the bearish path as well.
This member declared not having a position on this financial instrument or a related financial instrument.
About author

Offline


Add a comment
Comments
0 comments on the analysis AUD/USD - Daily