AUD/USD - Medium-Term Ascending Triangle Still Stands - RBA Meeting in Focus - 06/05/2017 (GMT)
- 613
- 0
- Who voted?
- Timeframe : Daily

AUD/USD Chart
Are you looking for opportunities in indices and forex?
DISCOVER LONDINIA OPPORTUNITIES...
DISCOVER LONDINIA OPPORTUNITIES...
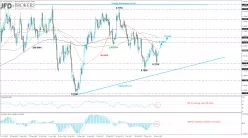
This week will be very busy for the AUD/USD traders as the RBA interest rate decision will take place on Tuesday. The Australian dollar is developing in an ascending triangle against the U.S. dollar since January of 2016 with strong resistance level at 0.7780 and a significant valid uptrend line. The commodity currency printed another red month and plunged 3% in the previous three months.
The price rebounded on the 0.7370 support level and is approaching the 50-daily SMA. If there is a successful attempt above the latter level will open the door for the 0.7515 – 0.7550 resistance zone which overlaps with the 200-daily SMA and further up with the 100-daily SMA. MACD and RSI are moving with some weakness. The RSI indicator entered the bullish area whilst the MACD oscillator created a bullish crossover with its trigger line.
The price rebounded on the 0.7370 support level and is approaching the 50-daily SMA. If there is a successful attempt above the latter level will open the door for the 0.7515 – 0.7550 resistance zone which overlaps with the 200-daily SMA and further up with the 100-daily SMA. MACD and RSI are moving with some weakness. The RSI indicator entered the bullish area whilst the MACD oscillator created a bullish crossover with its trigger line.
This member did not declare if he had a position on this financial instrument or a related financial instrument.
About author

Offline


Add a comment
Comments
0 comments on the analysis AUD/USD - Daily