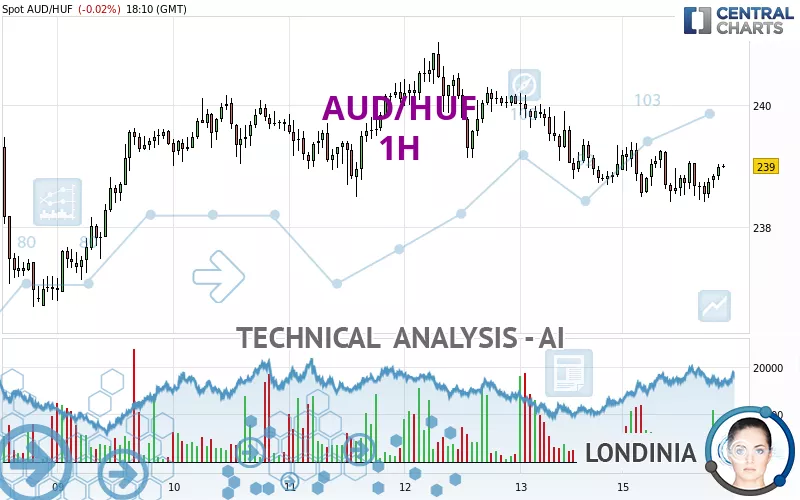
AUD/HUF - 1H - Technical analysis published on 09/16/2024 (GMT)
- 114
- 0
Click here for a new analysis!
- Timeframe : 1H
- - Analysis generated on
- Status : INVALID

Summary of the analysis

Additional analysis
Quotes
The AUD/HUF rating is 239.00 HUF. The price is lower by -0.02% since the last closing and was traded between 238.42 HUF and 239.40 HUF over the period. The price is currently at +0.24% from its lowest and -0.17% from its highest.A bearish opening was detected by the Central Gaps scanner. Sellers are trying to impose a bearish trend in the very short term.
Bearish opening
Type : Bearish
Timeframe : Openning
So that you have an overall view of the price change, here is a table showing the variations over several periods:
Near a new HIGH record (1 year)
Type : Bullish
Timeframe : Weekly
Near a new LOW record (1st january)
Type : Bearish
Timeframe : Weekly
Near a new HIGH record (1 month)
Type : Bullish
Timeframe : Weekly
Technical
A technical analysis in 1H of this AUD/HUF chart shows a bearish trend. The signals given by moving averages are 75.00% bearish. This bearish trend could slow down given the neutral signals currently being given by short-term moving averages. The Central Indicators scanner detects a bullish signal on moving averages that could impact this trend:
Bullish trend reversal : adaptative moving average 20
Type : Bullish
Timeframe : 1 hour
The probability of a further increase are moderate given the direction of the technical indicators.
The Central Indicators scanner found this result concerning these indicators:
Momentum indicator is back over 0
Type : Bullish
Timeframe : 1 hour
The Central Patterns scanner, which studies chart patterns, resistances and supports, has identified this signal:
Near resistance of channel
Type : Bearish
Timeframe : 1 hour
Central Candlesticks, the scanner specialised in Japanese candlesticks, detects this inversion signal that could impact the current short-term trend:
Doji
Type : Neutral
Timeframe : 1 hour
| S3 | S2 | S1 | Price | R1 | R2 | R3 | |
|---|---|---|---|---|---|---|---|
| ProTrendLines | 236.70 | 237.61 | 238.49 | 239.00 | 239.38 | 240.17 | 241.31 |
| Change (%) | -0.96% | -0.58% | -0.21% | - | +0.16% | +0.49% | +0.97% |
| Change | -2.30 | -1.39 | -0.51 | - | +0.38 | +1.17 | +2.31 |
| Level | Minor | Intermediate | Intermediate | - | Major | Intermediate | Major |
To determine price objectives, it is also possible to use the pivot points. Here is the price position in relation to pivot points:
| Pivot points | S3 | S2 | S1 | PP | R1 | R2 | R3 |
|---|---|---|---|---|---|---|---|
| Standard | 236.91 | 237.80 | 238.42 | 239.31 | 239.93 | 240.82 | 241.44 |
| Camarilla | 238.63 | 238.76 | 238.90 | 239.04 | 239.18 | 239.32 | 239.46 |
| Woodie | 236.78 | 237.73 | 238.29 | 239.24 | 239.80 | 240.75 | 241.31 |
| Fibonacci | 237.80 | 238.38 | 238.73 | 239.31 | 239.89 | 240.24 | 240.82 |
| Pivot points | S3 | S2 | S1 | PP | R1 | R2 | R3 |
|---|---|---|---|---|---|---|---|
| Standard | 232.50 | 234.61 | 236.82 | 238.93 | 241.14 | 243.25 | 245.46 |
| Camarilla | 237.85 | 238.25 | 238.64 | 239.04 | 239.44 | 239.83 | 240.23 |
| Woodie | 232.56 | 234.64 | 236.88 | 238.96 | 241.20 | 243.28 | 245.52 |
| Fibonacci | 234.61 | 236.26 | 237.28 | 238.93 | 240.58 | 241.60 | 243.25 |
| Pivot points | S3 | S2 | S1 | PP | R1 | R2 | R3 |
|---|---|---|---|---|---|---|---|
| Standard | 224.86 | 228.47 | 234.53 | 238.14 | 244.20 | 247.81 | 253.87 |
| Camarilla | 237.94 | 238.83 | 239.71 | 240.60 | 241.49 | 242.37 | 243.26 |
| Woodie | 226.10 | 229.08 | 235.77 | 238.75 | 245.44 | 248.42 | 255.11 |
| Fibonacci | 228.47 | 232.16 | 234.44 | 238.14 | 241.83 | 244.11 | 247.81 |
Numerical data
The following is the status of technical indicators and moving averages registered at the time this technical analysis was created:
| RSI (14): | 51.33 | |
| MACD (12,26,9): | -0.0900 | |
| Directional Movement: | 3.48 | |
| AROON (14): | -14.29 | |
| DEMA (21): | 238.73 | |
| Parabolic SAR (0,02-0,02-0,2): | 238.43 | |
| Elder Ray (13): | 0.15 | |
| Super Trend (3,10): | 239.69 | |
| Zig ZAG (10): | 239.00 | |
| VORTEX (21): | 1.0000 | |
| Stochastique (14,3,5): | 62.30 | |
| TEMA (21): | 238.81 | |
| Williams %R (14): | -30.95 | |
| Chande Momentum Oscillator (20): | 0.31 | |
| Repulse (5,40,3): | 0.1200 | |
| ROCnROLL: | -1 | |
| TRIX (15,9): | -0.0100 | |
| Courbe Coppock: | 0.08 |
| MA7: | 239.17 | |
| MA20: | 239.15 | |
| MA50: | 239.24 | |
| MA100: | 240.02 | |
| MAexp7: | 238.86 | |
| MAexp20: | 238.88 | |
| MAexp50: | 239.13 | |
| MAexp100: | 239.27 | |
| Price / MA7: | -0.07% | |
| Price / MA20: | -0.06% | |
| Price / MA50: | -0.10% | |
| Price / MA100: | -0.42% | |
| Price / MAexp7: | +0.06% | |
| Price / MAexp20: | +0.05% | |
| Price / MAexp50: | -0.05% | |
| Price / MAexp100: | -0.11% |
About author
Online


Add a comment
Comments
0 comments on the analysis AUD/HUF - 1H