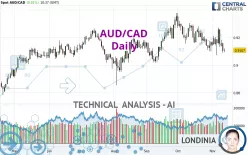
AUD/CAD - Daily - Technical analysis published on 11/13/2024 (GMT)
- 246
- 0
Click here for a new analysis!
- Timeframe : Daily
- - Analysis generated on
- Status : TARGET REACHED

Summary of the analysis

Additional analysis
Quotes
AUD/CAD rating 0.9107 CAD. The price has increased by +0.01% since the last closing with the lowest point at 0.9092 CAD and the highest point at 0.9121 CAD. The deviation from the price is +0.16% for the low point and -0.15% for the high point.Here is a more detailed summary of the historical variations registered by AUD/CAD:
Near a new LOW record (1 year)
Type : Bearish
Timeframe : Weekly
Near a new LOW record (1st january)
Type : Bearish
Timeframe : Weekly
Near a new HIGH record (1 month)
Type : Bullish
Timeframe : Weekly
Technical
Technical analysis of AUD/CAD in Daily shows an overall slightly bearish trend. Only 60.71% of the signals given by moving averages are bearish. This slightly bearish trend is reinforced by the strong signals currently being given by short-term moving averages. The Central Indicators market scanner is currently detecting a bearish signal that could impact this trend:
Bearish trend reversal : adaptative moving average 100
Type : Bearish
Timeframe : Daily
An assessment of technical indicators does not currently provide any relevant information to suggest whether the signal given by the technical indicators is more bullish or bearish.
Caution: the Central Indicators scanner currently detects an excess:
CCI indicator is oversold : under -100
Type : Neutral
Timeframe : Daily
Williams %R indicator is oversold : under -80
Type : Neutral
Timeframe : Daily
An analysis of the price chart with the Central Patterns scanner (detector of chart patterns and resistances and supports) shows several results that can have an impact on the price change:
Near horizontal support
Type : Bullish
Timeframe : Daily
Support of channel is broken
Type : Bearish
Timeframe : Daily
There is also a Japanese candlestick pattern detected by Central Candlesticks that could mark the end of the current short-term trend:
Doji
Type : Neutral
Timeframe : Daily
| S3 | S2 | S1 | Price | R1 | R2 | R3 | |
|---|---|---|---|---|---|---|---|
| ProTrendLines | 0.8862 | 0.8962 | 0.9063 | 0.9107 | 0.9126 | 0.9191 | 0.9251 |
| Change (%) | -2.69% | -1.59% | -0.48% | - | +0.21% | +0.92% | +1.58% |
| Change | -0.0245 | -0.0145 | -0.0044 | - | +0.0019 | +0.0084 | +0.0144 |
| Level | Minor | Major | Intermediate | - | Intermediate | Major | Intermediate |
Attention could also be paid to pivot points to set price objectives:
| Pivot points | S3 | S2 | S1 | PP | R1 | R2 | R3 |
|---|---|---|---|---|---|---|---|
| Standard | 0.9003 | 0.9046 | 0.9076 | 0.9119 | 0.9149 | 0.9192 | 0.9222 |
| Camarilla | 0.9086 | 0.9093 | 0.9099 | 0.9106 | 0.9113 | 0.9119 | 0.9126 |
| Woodie | 0.8997 | 0.9043 | 0.9070 | 0.9116 | 0.9143 | 0.9189 | 0.9216 |
| Fibonacci | 0.9046 | 0.9074 | 0.9091 | 0.9119 | 0.9147 | 0.9164 | 0.9192 |
| Pivot points | S3 | S2 | S1 | PP | R1 | R2 | R3 |
|---|---|---|---|---|---|---|---|
| Standard | 0.8863 | 0.8967 | 0.9062 | 0.9166 | 0.9261 | 0.9365 | 0.9460 |
| Camarilla | 0.9101 | 0.9120 | 0.9138 | 0.9156 | 0.9174 | 0.9193 | 0.9211 |
| Woodie | 0.8858 | 0.8965 | 0.9057 | 0.9164 | 0.9256 | 0.9363 | 0.9455 |
| Fibonacci | 0.8967 | 0.9043 | 0.9090 | 0.9166 | 0.9242 | 0.9289 | 0.9365 |
| Pivot points | S3 | S2 | S1 | PP | R1 | R2 | R3 |
|---|---|---|---|---|---|---|---|
| Standard | 0.8772 | 0.8935 | 0.9050 | 0.9213 | 0.9328 | 0.9491 | 0.9606 |
| Camarilla | 0.9088 | 0.9113 | 0.9139 | 0.9164 | 0.9190 | 0.9215 | 0.9241 |
| Woodie | 0.8747 | 0.8923 | 0.9025 | 0.9201 | 0.9303 | 0.9479 | 0.9581 |
| Fibonacci | 0.8935 | 0.9042 | 0.9107 | 0.9213 | 0.9320 | 0.9385 | 0.9491 |
Numerical data
The following is the status of technical indicators and moving averages registered at the time this technical analysis was created:
| RSI (14): | 42.32 | |
| MACD (12,26,9): | -0.0019 | |
| Directional Movement: | -5.8135 | |
| AROON (14): | 7.1429 | |
| DEMA (21): | 0.9149 | |
| Parabolic SAR (0,02-0,02-0,2): | 0.9084 | |
| Elder Ray (13): | -0.0053 | |
| Super Trend (3,10): | 0.9297 | |
| Zig ZAG (10): | 0.9109 | |
| VORTEX (21): | 0.9234 | |
| Stochastique (14,3,5): | 26.13 | |
| TEMA (21): | 0.9129 | |
| Williams %R (14): | -81.91 | |
| Chande Momentum Oscillator (20): | -0.0035 | |
| Repulse (5,40,3): | -0.4468 | |
| ROCnROLL: | 2 | |
| TRIX (15,9): | -0.0221 | |
| Courbe Coppock: | 0.93 |
| MA7: | 0.9161 | |
| MA20: | 0.9174 | |
| MA50: | 0.9193 | |
| MA100: | 0.9156 | |
| MAexp7: | 0.9144 | |
| MAexp20: | 0.9170 | |
| MAexp50: | 0.9176 | |
| MAexp100: | 0.9148 | |
| Price / MA7: | -0.59% | |
| Price / MA20: | -0.73% | |
| Price / MA50: | -0.94% | |
| Price / MA100: | -0.54% | |
| Price / MAexp7: | -0.40% | |
| Price / MAexp20: | -0.69% | |
| Price / MAexp50: | -0.75% | |
| Price / MAexp100: | -0.45% |
News
The latest news and videos published on AUD/CAD at the time of the analysis were as follows:
-
 AUD/CAD Forecast May 23, 2024
-
AUD/CAD Forecast January 6, 2023
-
S&P 500 Volatility Should Settle if Risk Appetite is Set, AUDCAD a Top Watch
-
Australian Dollar China GDP Analysis: AUD/USD, AUD/JPY, GBP/AUD, AUD/CAD
-
Australian Dollar Analysis: AUD/USD, AUD/JPY, AUD/CAD Gain as RBA Holds in February
About author

Online


Add a comment
Comments
0 comments on the analysis AUD/CAD - Daily