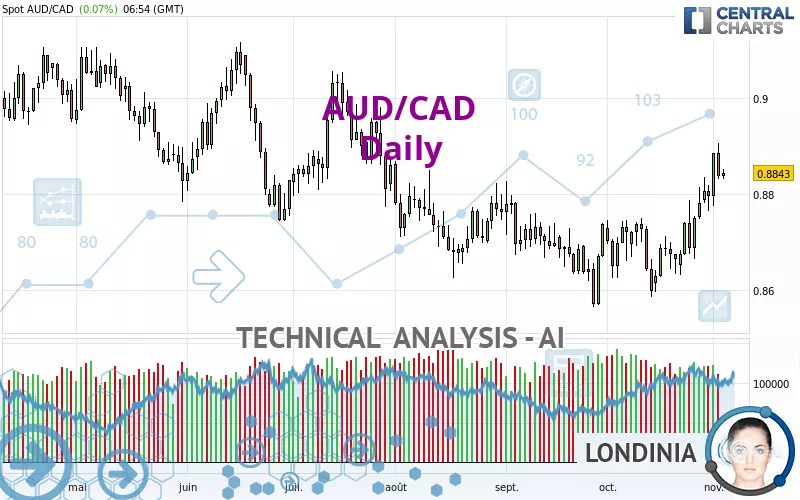
AUD/CAD - Daily - Technical analysis published on 11/03/2023 (GMT)
- 114
- 0
Click here for a new analysis!
- Timeframe : Daily
- - Analysis generated on
- Status : TARGET REACHED

Summary of the analysis

Additional analysis
Quotes
The AUD/CAD price is 0.8843 CAD. On the day, this instrument gained +0.07% with the lowest point at 0.8832 CAD and the highest point at 0.8851 CAD. The deviation from the price is +0.12% for the low point and -0.09% for the high point.Here is a more detailed summary of the historical variations registered by AUD/CAD:
Near a new LOW record (1 year)
Type : Bearish
Timeframe : Weekly
Near a new LOW record (1st january)
Type : Bearish
Timeframe : Weekly
Near a new LOW record (1 month)
Type : Bearish
Timeframe : Weekly
Technical
Technical analysis of AUD/CAD in Daily shows an overall bullish trend. 67.86% of the signals given by moving averages are bullish. The overall trend is reinforced by the strong bullish signals from short-term moving averages. There is no crossing of moving average by the price or crossing of moving averages between themselves.
Technical indicators are strongly bullish, suggesting that the price increase should continue.
But beware of excesses. The Central Indicators scanner currently detects this:
CCI indicator is overbought : over 100
Type : Neutral
Timeframe : Daily
Central Patterns, the market scanner focusing on chart patterns, resistances and supports found these results:
Near horizontal resistance
Type : Bearish
Timeframe : Daily
Resistance of channel is broken
Type : Bullish
Timeframe : Daily
The Central Candlesticks scanner which studies Japanese candlesticks did not detect anything.
| S3 | S2 | S1 | Price | R1 | R2 | R3 | |
|---|---|---|---|---|---|---|---|
| ProTrendLines | 0.8607 | 0.8751 | 0.8827 | 0.8843 | 0.8956 | 0.9093 | 0.9191 |
| Change (%) | -2.67% | -1.04% | -0.18% | - | +1.28% | +2.83% | +3.94% |
| Change | -0.0236 | -0.0092 | -0.0016 | - | +0.0113 | +0.0250 | +0.0348 |
| Level | Major | Major | Intermediate | - | Intermediate | Major | Major |
To determine price objectives, it is also possible to use the pivot points. Here is the price position in relation to pivot points:
| Pivot points | S3 | S2 | S1 | PP | R1 | R2 | R3 |
|---|---|---|---|---|---|---|---|
| Standard | 0.8734 | 0.8782 | 0.8810 | 0.8858 | 0.8886 | 0.8934 | 0.8962 |
| Camarilla | 0.8816 | 0.8823 | 0.8830 | 0.8837 | 0.8844 | 0.8851 | 0.8858 |
| Woodie | 0.8723 | 0.8777 | 0.8799 | 0.8853 | 0.8875 | 0.8929 | 0.8951 |
| Fibonacci | 0.8782 | 0.8811 | 0.8829 | 0.8858 | 0.8887 | 0.8905 | 0.8934 |
| Pivot points | S3 | S2 | S1 | PP | R1 | R2 | R3 |
|---|---|---|---|---|---|---|---|
| Standard | 0.8487 | 0.8559 | 0.8670 | 0.8742 | 0.8853 | 0.8925 | 0.9036 |
| Camarilla | 0.8731 | 0.8748 | 0.8764 | 0.8781 | 0.8798 | 0.8815 | 0.8831 |
| Woodie | 0.8507 | 0.8569 | 0.8690 | 0.8752 | 0.8873 | 0.8935 | 0.9056 |
| Fibonacci | 0.8559 | 0.8629 | 0.8672 | 0.8742 | 0.8812 | 0.8855 | 0.8925 |
| Pivot points | S3 | S2 | S1 | PP | R1 | R2 | R3 |
|---|---|---|---|---|---|---|---|
| Standard | 0.8392 | 0.8488 | 0.8642 | 0.8738 | 0.8892 | 0.8988 | 0.9142 |
| Camarilla | 0.8726 | 0.8749 | 0.8772 | 0.8795 | 0.8818 | 0.8841 | 0.8864 |
| Woodie | 0.8420 | 0.8503 | 0.8670 | 0.8753 | 0.8920 | 0.9003 | 0.9170 |
| Fibonacci | 0.8488 | 0.8584 | 0.8643 | 0.8738 | 0.8834 | 0.8893 | 0.8988 |
Numerical data
The following are the details of the technical indicators and moving averages that were collected to generate this technical analysis:
| RSI (14): | 60.96 | |
| MACD (12,26,9): | 0.0038 | |
| Directional Movement: | 16.3300 | |
| AROON (14): | 92.8571 | |
| DEMA (21): | 0.8793 | |
| Parabolic SAR (0,02-0,02-0,2): | 0.8702 | |
| Elder Ray (13): | 0.0066 | |
| Super Trend (3,10): | 0.8658 | |
| Zig ZAG (10): | 0.8841 | |
| VORTEX (21): | 1.0985 | |
| Stochastique (14,3,5): | 84.76 | |
| TEMA (21): | 0.8834 | |
| Williams %R (14): | -23.21 | |
| Chande Momentum Oscillator (20): | 0.0157 | |
| Repulse (5,40,3): | 0.2858 | |
| ROCnROLL: | 1 | |
| TRIX (15,9): | 0.0311 | |
| Courbe Coppock: | 3.20 |
| MA7: | 0.8814 | |
| MA20: | 0.8728 | |
| MA50: | 0.8713 | |
| MA100: | 0.8772 | |
| MAexp7: | 0.8811 | |
| MAexp20: | 0.8753 | |
| MAexp50: | 0.8738 | |
| MAexp100: | 0.8785 | |
| Price / MA7: | +0.33% | |
| Price / MA20: | +1.32% | |
| Price / MA50: | +1.49% | |
| Price / MA100: | +0.81% | |
| Price / MAexp7: | +0.36% | |
| Price / MAexp20: | +1.03% | |
| Price / MAexp50: | +1.20% | |
| Price / MAexp100: | +0.66% |
News
The latest news and videos published on AUD/CAD at the time of the analysis were as follows:
-
 AUD/CAD Forecast January 6, 2023
-
S&P 500 Volatility Should Settle if Risk Appetite is Set, AUDCAD a Top Watch
-
Australian Dollar China GDP Analysis: AUD/USD, AUD/JPY, GBP/AUD, AUD/CAD
-
Australian Dollar Analysis: AUD/USD, AUD/JPY, AUD/CAD Gain as RBA Holds in February
-
AUD/USD, AUD/JPY, AUD/CAD, AUD/NZD Analysis - Australia Jobs Report Coverage
About author

Online


Add a comment
Comments
0 comments on the analysis AUD/CAD - Daily