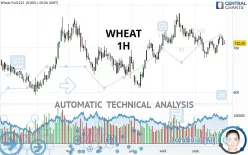
WHEAT - 1H - Technical analysis published on 09/30/2021 (GMT)
- 182
- 0
Click here for a new analysis!
- Timeframe : 1H
- - Analysis generated on
- Status : INVALID

Summary of the analysis
Additional analysis
Quotes
The WHEAT rating is 708.75 USD. The price is lower by -0.21% since the last closing with the lowest point at 707.25 USD and the highest point at 711.50 USD. The deviation from the price is +0.21% for the low point and -0.39% for the high point.A bullish opening was detected by the Central Gaps scanner. Buyers are trying to impose a bullish momentum in the very short term.
Bullish opening
Type : Bullish
Timeframe : Openning
Here is a more detailed summary of the historical variations registered by WHEAT:
Technical
A technical analysis in 1H of this WHEAT chart shows a bearish trend. 78.57% of the signals given by moving averages are bearish. The overall trend is reinforced by the strong bearish signals from short-term moving averages. There is no crossing of moving average by the price or crossing of moving averages between themselves.
In fact, 12 technical indicators on 18 studied are currently bearish. Caution: the Central Indicators scanner currently detects an excess:
RSI indicator: bullish divergence
Type : Bullish
Timeframe : 1 hour
Williams %R indicator is oversold : under -80
Type : Neutral
Timeframe : 1 hour
MACD crosses DOWN its Moving Average
Type : Bearish
Timeframe : 1 hour
Price is back over the pivot point
Type : Bullish
Timeframe : Weekly
Momentum indicator is back under 0
Type : Bearish
Timeframe : 1 hour
No signals are given by Central Patterns, a market scanner specialised in chart patterns, resistances and supports.
There is also a Japanese candlestick pattern detected by Central Candlesticks that could mark the end of the current short-term trend:
White hanging man / hammer
Type : Neutral
Timeframe : 1 hour
| S3 | S2 | S1 | Price | R1 | R2 | R3 | |
|---|---|---|---|---|---|---|---|
| ProTrendLines | 695.85 | 701.00 | 708.45 | 708.75 | 712.92 | 719.67 | 726.92 |
| Change (%) | -1.82% | -1.09% | -0.04% | - | +0.59% | +1.54% | +2.56% |
| Change | -12.90 | -7.75 | -0.30 | - | +4.17 | +10.92 | +18.17 |
| Level | Minor | Minor | Intermediate | - | Intermediate | Minor | Intermediate |
To determine price objectives, it is also possible to use the pivot points. Here is the price position in relation to pivot points:
| Pivot points | S3 | S2 | S1 | PP | R1 | R2 | R3 |
|---|---|---|---|---|---|---|---|
| Standard | 697.42 | 702.83 | 706.92 | 712.33 | 716.42 | 721.83 | 725.92 |
| Camarilla | 708.39 | 709.26 | 710.13 | 711.00 | 711.87 | 712.74 | 713.61 |
| Woodie | 696.75 | 702.50 | 706.25 | 712.00 | 715.75 | 721.50 | 725.25 |
| Fibonacci | 702.83 | 706.46 | 708.70 | 712.33 | 715.96 | 718.20 | 721.83 |
| Pivot points | S3 | S2 | S1 | PP | R1 | R2 | R3 |
|---|---|---|---|---|---|---|---|
| Standard | 657.67 | 671.83 | 697.42 | 711.58 | 737.17 | 751.33 | 776.92 |
| Camarilla | 712.07 | 715.71 | 719.36 | 723.00 | 726.64 | 730.29 | 733.93 |
| Woodie | 663.38 | 674.69 | 703.13 | 714.44 | 742.88 | 754.19 | 782.63 |
| Fibonacci | 671.83 | 687.02 | 696.40 | 711.58 | 726.77 | 736.15 | 751.33 |
| Pivot points | S3 | S2 | S1 | PP | R1 | R2 | R3 |
|---|---|---|---|---|---|---|---|
| Standard | 611.33 | 657.67 | 685.58 | 731.92 | 759.83 | 806.17 | 834.08 |
| Camarilla | 693.08 | 699.89 | 706.69 | 713.50 | 720.31 | 727.11 | 733.92 |
| Woodie | 602.13 | 653.06 | 676.38 | 727.31 | 750.63 | 801.56 | 824.88 |
| Fibonacci | 657.67 | 686.03 | 703.55 | 731.92 | 760.28 | 777.80 | 806.17 |
Numerical data
The following are the details of the technical indicators and moving averages that were collected to generate this technical analysis:
| RSI (14): | 38.83 | |
| MACD (12,26,9): | -1.4900 | |
| Directional Movement: | -9.94 | |
| AROON (14): | -64.29 | |
| DEMA (21): | 709.70 | |
| Parabolic SAR (0,02-0,02-0,2): | 717.22 | |
| Elder Ray (13): | -3.01 | |
| Super Trend (3,10): | 716.97 | |
| Zig ZAG (10): | 708.75 | |
| VORTEX (21): | 0.9800 | |
| Stochastique (14,3,5): | 10.06 | |
| TEMA (21): | 710.13 | |
| Williams %R (14): | -83.33 | |
| Chande Momentum Oscillator (20): | -2.00 | |
| Repulse (5,40,3): | -0.1200 | |
| ROCnROLL: | 2 | |
| TRIX (15,9): | -0.0300 | |
| Courbe Coppock: | 0.24 |
| MA7: | 713.82 | |
| MA20: | 708.09 | |
| MA50: | 716.49 | |
| MA100: | 693.65 | |
| MAexp7: | 710.49 | |
| MAexp20: | 711.67 | |
| MAexp50: | 713.96 | |
| MAexp100: | 713.47 | |
| Price / MA7: | -0.71% | |
| Price / MA20: | +0.09% | |
| Price / MA50: | -1.08% | |
| Price / MA100: | +2.18% | |
| Price / MAexp7: | -0.24% | |
| Price / MAexp20: | -0.41% | |
| Price / MAexp50: | -0.73% | |
| Price / MAexp100: | -0.66% |
News
Don't forget to follow the news on WHEAT. At the time of publication of this analysis, the latest news was as follows:
-
 New strain of Monsanto GM wheat escapes lab, grows in wild
-
Trading Wheat. Commodity Brief
-
Gene-Edited Gluten Makes Wheat For Celiac Disease Sufferers
-
What’s next for wheat after surge — #SaxoStrats
-
Are Wheat Prices Sustainable?
About author

Online


Add a comment
Comments
0 comments on the analysis WHEAT - 1H