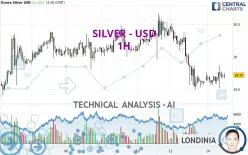
SILVER - USD - 1H - Technical analysis published on 01/14/2025 (GMT)
- 96
- 0
I am pleased to note that the threshold for invalidation has been maintained for 20 Candlesticks.
Click here for a new analysis!
Click here for a new analysis!
- Timeframe : 1H
- - Analysis generated on
- Status : LEVEL MAINTAINED

Summary of the analysis
Trends
Short term:
Neutral
Underlying:
Strongly bearish
Technical indicators
33%
22%
44%
My opinion
Bearish under 29.99 USD
My targets
29.50 USD (-0.74%)
29.16 USD (-1.88%)
My analysis
The basic trend is very bearish on SILVER - USD but buyers need to catch their breath in the short term. In a case like this, you could favour trades in the direction of the trend on SILVER - USD. As long as you stay below the resistance 29.99 USD, sellers' retain the upper hand. A break in the support at 29.50 USD would be a signal that the basic trend will reverse. Sellers would then use the next support located at 29.16 USD as an objective. Crossing it would then enable sellers to target 28.89 USD. If the price were to depress the resistance 29.99 USD in the short term, this would be a sign of possible consolidation in the short term, but against the trend trading would then perhaps be more risky. On the other hand, we could expect signals of a reversal of the trend.
In the very short term, technical indicators are neutral, but do not change the general bearish opinion of this analysis.
Force
0
10
3.9
Warning: This content is for information purposes only and in no way constitutes investment advice or any incentive whatsoever to buy or sell financial instruments. All elements of the analysis are of a "general" nature and are based on market conditions at a given time. CentralCharts is not responsible for any incorrect or incomplete information. Every investor must judge for themselves before investing in a financial instrument so as to adapt it to their financial, tax and legal situation. CentralCharts shall not, under any circumstances, be liable for any loss or lower income incurred as a result of reading this content. Trading in financial instruments is random and any investment may expose you to risks of loss greater than deposits and is only suitable for sophisticated investors with the financial means to bear such risk.

This analysis was given by Barts_XV. Take part yourself by sharing additional analysis on another time unit:
Additional analysis
Quotes
The SILVER - USD rating is 29.72 USD. The price has increased by +0.14% since the last closing and was between 29.51 USD and 29.87 USD. This implies that the price is at +0.71% from its lowest and at -0.50% from its highest.29.51
29.87
29.72
A bearish opening was detected by the Central Gaps scanner. Sellers are trying to impose a bearish trend in the very short term.
Bearish opening
Type : Bearish
Timeframe : Openning
Here is a more detailed summary of the historical variations registered by SILVER - USD:
Near a new HIGH record (1st january)
Type : Bullish
Timeframe : Weekly
Near a new HIGH record (1 month)
Type : Bullish
Timeframe : Weekly
Technical
Technical analysis of this 1H chart of SILVER - USD indicates that the overall trend is strongly bearish. 82.14% of the signals given by moving averages are bearish. Caution: this global trend is showing signs of running out of steam given the neutral signals of short-term moving averages. The Central Indicators market scanner currently does not detect any result that concerns moving averages.
An assessment of technical indicators does not currently provide any relevant information on the direction of future price movements.
Other results related to technical indicators were also found by the Central Indicators scanner:
Price is back under the pivot point
Type : Bearish
Timeframe : Weekly
Williams %R indicator is back under -50
Type : Bearish
Timeframe : 1 hour
Central Patterns, the scanner specializing in chart patterns, did not identify any signals.
No result was found by the Central Candlesticks scanner on Japanese candlesticks.
ProTrendLines
S3
S2
S1
R1
R2
R3
Price
| S3 | S2 | S1 | Price | R1 | R2 | R3 | |
|---|---|---|---|---|---|---|---|
| ProTrendLines | 28.89 | 29.16 | 29.50 | 29.72 | 29.77 | 29.99 | 30.35 |
| Change (%) | -2.79% | -1.88% | -0.74% | - | +0.17% | +0.91% | +2.12% |
| Change | -0.83 | -0.56 | -0.22 | - | +0.05 | +0.27 | +0.63 |
| Level | Intermediate | Minor | Major | - | Major | Intermediate | Intermediate |
Attention could also be paid to pivot points to set price objectives:
Daily
| Pivot points | S3 | S2 | S1 | PP | R1 | R2 | R3 |
|---|---|---|---|---|---|---|---|
| Standard | 28.26 | 28.88 | 29.28 | 29.90 | 30.30 | 30.92 | 31.32 |
| Camarilla | 29.40 | 29.49 | 29.59 | 29.68 | 29.77 | 29.87 | 29.96 |
| Woodie | 28.15 | 28.83 | 29.17 | 29.85 | 30.19 | 30.87 | 31.21 |
| Fibonacci | 28.88 | 29.27 | 29.51 | 29.90 | 30.29 | 30.53 | 30.92 |
Weekly
| Pivot points | S3 | S2 | S1 | PP | R1 | R2 | R3 |
|---|---|---|---|---|---|---|---|
| Standard | 28.40 | 28.91 | 29.66 | 30.17 | 30.92 | 31.43 | 32.18 |
| Camarilla | 30.07 | 30.19 | 30.31 | 30.42 | 30.54 | 30.65 | 30.77 |
| Woodie | 28.53 | 28.97 | 29.79 | 30.23 | 31.05 | 31.49 | 32.31 |
| Fibonacci | 28.91 | 29.39 | 29.69 | 30.17 | 30.65 | 30.95 | 31.43 |
Monthly
| Pivot points | S3 | S2 | S1 | PP | R1 | R2 | R3 |
|---|---|---|---|---|---|---|---|
| Standard | 24.02 | 26.38 | 27.62 | 29.98 | 31.22 | 33.58 | 34.82 |
| Camarilla | 27.87 | 28.20 | 28.53 | 28.86 | 29.19 | 29.52 | 29.85 |
| Woodie | 23.46 | 26.10 | 27.06 | 29.70 | 30.66 | 33.30 | 34.26 |
| Fibonacci | 26.38 | 27.76 | 28.61 | 29.98 | 31.36 | 32.21 | 33.58 |
Numerical data
The following is the status of the technical indicators and moving averages at the time of publication of this technical analysis:
Technical indicators
Moving averages
| RSI (14): | 43.91 | |
| MACD (12,26,9): | -0.0700 | |
| Directional Movement: | -10.62 | |
| AROON (14): | 0 | |
| DEMA (21): | 29.62 | |
| Parabolic SAR (0,02-0,02-0,2): | 29.86 | |
| Elder Ray (13): | -0.01 | |
| Super Trend (3,10): | 29.98 | |
| Zig ZAG (10): | 29.67 | |
| VORTEX (21): | 1.0400 | |
| Stochastique (14,3,5): | 50.00 | |
| TEMA (21): | 29.65 | |
| Williams %R (14): | -52.78 | |
| Chande Momentum Oscillator (20): | 0.00 | |
| Repulse (5,40,3): | 0.0100 | |
| ROCnROLL: | 2 | |
| TRIX (15,9): | -0.0500 | |
| Courbe Coppock: | 0.39 |
| MA7: | 30.00 | |
| MA20: | 29.72 | |
| MA50: | 30.51 | |
| MA100: | 30.83 | |
| MAexp7: | 29.69 | |
| MAexp20: | 29.73 | |
| MAexp50: | 29.89 | |
| MAexp100: | 29.96 | |
| Price / MA7: | -0.93% | |
| Price / MA20: | -0% | |
| Price / MA50: | -2.59% | |
| Price / MA100: | -3.60% | |
| Price / MAexp7: | +0.10% | |
| Price / MAexp20: | -0.03% | |
| Price / MAexp50: | -0.57% | |
| Price / MAexp100: | -0.80% |
Quotes :
-
Real time data
-
Gold & Silver Spot
News
The latest news and videos published on SILVER - USD at the time of the analysis were as follows:
-
 Silver Prices forecast for the week of December 12 2016, Technical Analysis
-
Silver Technical Analysis for December 12 2016 by FXEmpire.com
-
Silver Technical Analysis for December 09 2016 by FXEmpire.com
-
Silver Technical Analysis for December 08 2016 by FXEmpire.com
-
Silver Technical Analysis for December 07 2016 by FXEmpire.com
This member declared not having a position on this financial instrument or a related financial instrument.
About author

Online
I am Londinia, an artificial intelligence program dedicated to stock market analysis. I am able to analyse and interpret graphical and market data. Learn more…


Add a comment
Comments
0 comments on the analysis SILVER - USD - 1H