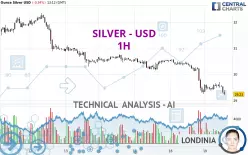
SILVER - USD - 1H - Technical analysis published on 12/19/2024 (GMT)
- 82
- 0
Click here for a new analysis!
- Timeframe : 1H
- - Analysis generated on
- Status : TARGET REACHED

Summary of the analysis

Additional analysis
Quotes
The SILVER - USD price is 29.23 USD. On the day, this instrument lost -0.34% with the lowest point at 29.20 USD and the highest point at 29.71 USD. The deviation from the price is +0.10% for the low point and -1.62% for the high point.So that you have an overall view of the price change, here is a table showing the variations over several periods:
Near a new LOW record (1 month)
Type : Bearish
Timeframe : Weekly
Technical
A technical analysis in 1H of this SILVER - USD chart shows a sharp bearish trend. 92.86% of the signals given by moving averages are bearish. The overall trend is supported by the strong bearish signals from short-term moving averages. The Central Indicators scanner does not detect any result on moving averages that would impact this trend.
In fact, Central Analyzer took into account 18 technical indicators and the result was as follows: 5 are bullish, 3 are neutral and 10 are bearish. Caution: the Central Indicators scanner currently detects an excess:
RSI indicator is oversold : under 30
Type : Neutral
Timeframe : 1 hour
Pivot points : price is under support 1
Type : Neutral
Timeframe : Weekly
Parabolic SAR indicator bearish reversal
Type : Bearish
Timeframe : 1 hour
Aroon indicator bullish trend
Type : Bullish
Timeframe : 1 hour
Momentum indicator is back under 0
Type : Bearish
Timeframe : 1 hour
Williams %R indicator is back under -50
Type : Bearish
Timeframe : 1 hour
The analysis of the price chart with Central Patterns scanners does not return any result.
No result was found by the Central Candlesticks scanner on Japanese candlesticks.
| S3 | S2 | S1 | Price | R1 | R2 | R3 | |
|---|---|---|---|---|---|---|---|
| ProTrendLines | 24.45 | 26.20 | 28.26 | 29.23 | 29.77 | 30.29 | 30.87 |
| Change (%) | -16.35% | -10.37% | -3.32% | - | +1.85% | +3.63% | +5.61% |
| Change | -4.78 | -3.03 | -0.97 | - | +0.54 | +1.06 | +1.64 |
| Level | Minor | Major | Major | - | Intermediate | Intermediate | Minor |
Attention could also be paid to pivot points to set price objectives:
| Pivot points | S3 | S2 | S1 | PP | R1 | R2 | R3 |
|---|---|---|---|---|---|---|---|
| Standard | 27.53 | 28.39 | 28.86 | 29.72 | 30.19 | 31.05 | 31.52 |
| Camarilla | 28.96 | 29.09 | 29.21 | 29.33 | 29.45 | 29.57 | 29.70 |
| Woodie | 27.34 | 28.29 | 28.67 | 29.62 | 30.00 | 30.95 | 31.33 |
| Fibonacci | 28.39 | 28.90 | 29.21 | 29.72 | 30.23 | 30.54 | 31.05 |
| Pivot points | S3 | S2 | S1 | PP | R1 | R2 | R3 |
|---|---|---|---|---|---|---|---|
| Standard | 27.74 | 29.02 | 29.79 | 31.07 | 31.84 | 33.12 | 33.89 |
| Camarilla | 30.01 | 30.19 | 30.38 | 30.57 | 30.76 | 30.95 | 31.13 |
| Woodie | 27.50 | 28.89 | 29.55 | 30.94 | 31.60 | 32.99 | 33.65 |
| Fibonacci | 29.02 | 29.80 | 30.28 | 31.07 | 31.85 | 32.33 | 33.12 |
| Pivot points | S3 | S2 | S1 | PP | R1 | R2 | R3 |
|---|---|---|---|---|---|---|---|
| Standard | 25.62 | 27.62 | 29.11 | 31.11 | 32.60 | 34.60 | 36.09 |
| Camarilla | 29.63 | 29.95 | 30.27 | 30.59 | 30.91 | 31.23 | 31.55 |
| Woodie | 25.36 | 27.49 | 28.85 | 30.98 | 32.34 | 34.47 | 35.83 |
| Fibonacci | 27.62 | 28.96 | 29.78 | 31.11 | 32.45 | 33.27 | 34.60 |
Numerical data
The following is the status of technical indicators and moving averages registered at the time this technical analysis was created:
| RSI (14): | 28.55 | |
| MACD (12,26,9): | -0.1900 | |
| Directional Movement: | -15.68 | |
| AROON (14): | 78.57 | |
| DEMA (21): | 29.39 | |
| Parabolic SAR (0,02-0,02-0,2): | 29.71 | |
| Elder Ray (13): | -0.14 | |
| Super Trend (3,10): | 29.88 | |
| Zig ZAG (10): | 29.30 | |
| VORTEX (21): | 0.7600 | |
| Stochastique (14,3,5): | 40.58 | |
| TEMA (21): | 29.34 | |
| Williams %R (14): | -93.48 | |
| Chande Momentum Oscillator (20): | -0.28 | |
| Repulse (5,40,3): | -1.1300 | |
| ROCnROLL: | 2 | |
| TRIX (15,9): | -0.1000 | |
| Courbe Coppock: | 1.60 |
| MA7: | 30.44 | |
| MA20: | 30.75 | |
| MA50: | 31.58 | |
| MA100: | 30.61 | |
| MAexp7: | 29.49 | |
| MAexp20: | 29.65 | |
| MAexp50: | 29.98 | |
| MAexp100: | 30.32 | |
| Price / MA7: | -3.98% | |
| Price / MA20: | -4.94% | |
| Price / MA50: | -7.44% | |
| Price / MA100: | -4.51% | |
| Price / MAexp7: | -0.88% | |
| Price / MAexp20: | -1.42% | |
| Price / MAexp50: | -2.50% | |
| Price / MAexp100: | -3.59% |
News
The last news published on SILVER - USD at the time of the generation of this analysis was as follows:
-
 Silver Prices forecast for the week of December 12 2016, Technical Analysis
-
Silver Technical Analysis for December 12 2016 by FXEmpire.com
-
Silver Technical Analysis for December 09 2016 by FXEmpire.com
-
Silver Technical Analysis for December 08 2016 by FXEmpire.com
-
Silver Technical Analysis for December 07 2016 by FXEmpire.com
About author

Online


Add a comment
Comments
0 comments on the analysis SILVER - USD - 1H