SILVER - USD - 1H - Technical analysis published on 11/04/2024 (GMT)
- 124
- 0
Click here for a new analysis!
- Timeframe : 1H
- - Analysis generated on
- Status : LEVEL MAINTAINED
Summary of the analysis

Additional analysis
Quotes
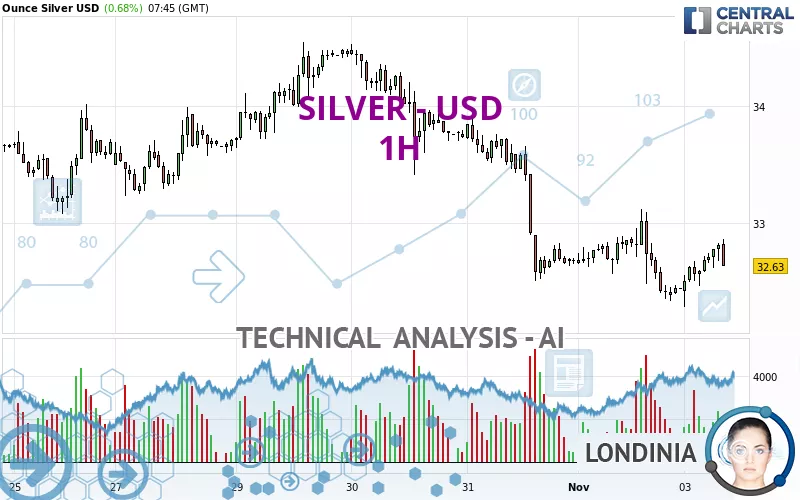
The SILVER - USD rating is 32.63 USD. The price has increased by +0.68% since the last closing and was between 32.28 USD and 32.86 USD. This implies that the price is at +1.08% from its lowest and at -0.70% from its highest.The Central Gaps scanner detects a bearish opening marking the presence of sellers ahead of buyers at the opening but not sufficiently marked to allow the price to register a quotation gap.
Bearish opening
Type : Bearish
Timeframe : Openning
Here is a more detailed summary of the historical variations registered by SILVER - USD:
Technical
A technical analysis in 1H of this SILVER - USD chart shows a sharp bearish trend. 82.14% of the signals given by moving averages are bearish. Caution: as the signals currently given by short-term moving averages are rather neutral, the strongly bearish trend is showing signs of running out of steam. An assessment of moving averages reveals several bearish signals that could impact this trend:
Bearish price crossover with adaptative moving average 20
Type : Bearish
Timeframe : 1 hour
Bearish price crossover with adaptative moving average 50
Type : Bearish
Timeframe : 1 hour
In fact, only 8 technical indicators out of 18 studied are currently positioned bullish. But beware of excesses. The Central Indicators scanner currently detects this:
RSI indicator: bearish divergence
Type : Bearish
Timeframe : 1 hour
RSI indicator is back under 50
Type : Bearish
Timeframe : 1 hour
Aroon indicator bullish trend
Type : Bullish
Timeframe : 1 hour
No signals are given by Central Patterns, a market scanner specialised in chart patterns, resistances and supports.
Central Candlesticks, the scanner specialised in Japanese candlesticks, detects a bearish signal that could support the hypothesis of a small drop in the very short term:
Bearish engulfing lines
Type : Bearish
Timeframe : 1 hour
| S3 | S2 | S1 | Price | R1 | R2 | R3 | |
|---|---|---|---|---|---|---|---|
| ProTrendLines | 29.77 | 32.06 | 32.56 | 32.63 | 33.41 | 33.67 | 34.01 |
| Change (%) | -8.76% | -1.75% | -0.21% | - | +2.39% | +3.19% | +4.23% |
| Change | -2.86 | -0.57 | -0.07 | - | +0.78 | +1.04 | +1.38 |
| Level | Intermediate | Major | Minor | - | Minor | Minor | Intermediate |
Attention could also be paid to pivot points to set price objectives:
| Pivot points | S3 | S2 | S1 | PP | R1 | R2 | R3 |
|---|---|---|---|---|---|---|---|
| Standard | 31.35 | 31.84 | 32.14 | 32.63 | 32.93 | 33.42 | 33.72 |
| Camarilla | 32.22 | 32.30 | 32.37 | 32.44 | 32.51 | 32.59 | 32.66 |
| Woodie | 31.26 | 31.79 | 32.05 | 32.58 | 32.84 | 33.37 | 33.63 |
| Fibonacci | 31.84 | 32.14 | 32.33 | 32.63 | 32.93 | 33.12 | 33.42 |
| Pivot points | S3 | S2 | S1 | PP | R1 | R2 | R3 |
|---|---|---|---|---|---|---|---|
| Standard | 29.44 | 30.89 | 31.66 | 33.11 | 33.88 | 35.33 | 36.10 |
| Camarilla | 31.83 | 32.03 | 32.24 | 32.44 | 32.64 | 32.85 | 33.05 |
| Woodie | 29.11 | 30.72 | 31.33 | 32.94 | 33.55 | 35.16 | 35.77 |
| Fibonacci | 30.89 | 31.74 | 32.26 | 33.11 | 33.96 | 34.48 | 35.33 |
| Pivot points | S3 | S2 | S1 | PP | R1 | R2 | R3 |
|---|---|---|---|---|---|---|---|
| Standard | 25.49 | 27.80 | 30.24 | 32.55 | 34.99 | 37.30 | 39.74 |
| Camarilla | 31.36 | 31.80 | 32.24 | 32.67 | 33.11 | 33.54 | 33.98 |
| Woodie | 25.55 | 27.83 | 30.30 | 32.58 | 35.05 | 37.33 | 39.80 |
| Fibonacci | 27.80 | 29.62 | 30.74 | 32.55 | 34.37 | 35.49 | 37.30 |
Numerical data
The following are the details of the technical indicators and moving averages that were collected to generate this technical analysis:
| RSI (14): | 48.06 | |
| MACD (12,26,9): | -0.0400 | |
| Directional Movement: | -3.80 | |
| AROON (14): | 57.14 | |
| DEMA (21): | 32.59 | |
| Parabolic SAR (0,02-0,02-0,2): | 32.37 | |
| Elder Ray (13): | 0.10 | |
| Super Trend (3,10): | 32.93 | |
| Zig ZAG (10): | 32.68 | |
| VORTEX (21): | 0.9700 | |
| Stochastique (14,3,5): | 85.41 | |
| TEMA (21): | 32.69 | |
| Williams %R (14): | -29.31 | |
| Chande Momentum Oscillator (20): | 0.28 | |
| Repulse (5,40,3): | 0.0200 | |
| ROCnROLL: | -1 | |
| TRIX (15,9): | -0.0400 | |
| Courbe Coppock: | 0.13 |
| MA7: | 33.34 | |
| MA20: | 32.66 | |
| MA50: | 31.21 | |
| MA100: | 30.22 | |
| MAexp7: | 32.69 | |
| MAexp20: | 32.67 | |
| MAexp50: | 32.89 | |
| MAexp100: | 33.20 | |
| Price / MA7: | -2.13% | |
| Price / MA20: | -0.09% | |
| Price / MA50: | +4.55% | |
| Price / MA100: | +7.97% | |
| Price / MAexp7: | -0.18% | |
| Price / MAexp20: | -0.12% | |
| Price / MAexp50: | -0.79% | |
| Price / MAexp100: | -1.72% |
News
The last news published on SILVER - USD at the time of the generation of this analysis was as follows:
-
 Silver Prices forecast for the week of December 12 2016, Technical Analysis
-
Silver Technical Analysis for December 12 2016 by FXEmpire.com
-
Silver Technical Analysis for December 09 2016 by FXEmpire.com
-
Silver Technical Analysis for December 08 2016 by FXEmpire.com
-
Silver Technical Analysis for December 07 2016 by FXEmpire.com
About author

Online


Add a comment
Comments
0 comments on the analysis SILVER - USD - 1H