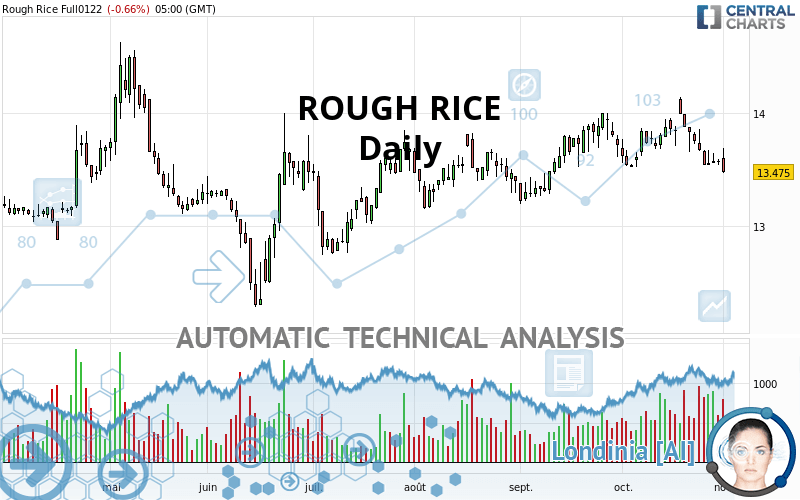
ROUGH RICE - Daily - Technical analysis published on 11/02/2021 (GMT)
- 190
- 0
Click here for a new analysis!
- Timeframe : Daily
- - Analysis generated on
- Status : TARGET REACHED

Summary of the analysis

Additional analysis
Quotes
The ROUGH RICE rating is 13.475 USD. The price registered a decrease of -0.66% on the session and was between 13.465 USD and 13.685 USD. This implies that the price is at +0.07% from its lowest and at -1.53% from its highest.So that you have an overall view of the price change, here is a table showing the variations over several periods:
Technical
Technical analysis of this Daily chart of ROUGH RICE indicates that the overall trend is slightly bearish. 53.57% of the signals given by moving averages are bearish. This bearish trend does not seem to be increasing given the slightly bearish signals given by short-term moving averages. The Central Indicators scanner detects bearish signals on moving averages that could impact this trend:
Bearish trend reversal : Moving Average 50
Type : Bearish
Timeframe : Daily
Bearish trend reversal : adaptative moving average 100
Type : Bearish
Timeframe : Daily
Bearish price crossover with adaptative moving average 20
Type : Bearish
Timeframe : Daily
Bearish price crossover with adaptative moving average 50
Type : Bearish
Timeframe : Daily
An assessment of technical indicators shows a strong bearish signal.
Caution: the Central Indicators scanner currently detects an excess:
CCI indicator is oversold : under -100
Type : Neutral
Timeframe : Daily
Williams %R indicator is oversold : under -80
Type : Neutral
Timeframe : Daily
Ichimoku - Bearish crossover : Tenkan & Kijun
Type : Bearish
Timeframe : Daily
Price is back under the pivot point
Type : Bearish
Timeframe : Daily
Price is back under the pivot point
Type : Bearish
Timeframe : Weekly
Central Patterns, the scanner specializing in chart patterns, did not identify any signals.
The Central Candlesticks scanner, specialised in Japanese candlesticks, did not identify any signals.
| S3 | S2 | S1 | Price | R1 | R2 | R3 | |
|---|---|---|---|---|---|---|---|
| ProTrendLines | 12.310 | 12.880 | 13.310 | 13.475 | 13.739 | 13.992 | 14.490 |
| Change (%) | -8.65% | -4.42% | -1.22% | - | +1.96% | +3.84% | +7.53% |
| Change | -1.165 | -0.595 | -0.165 | - | +0.264 | +0.517 | +1.015 |
| Level | Minor | Minor | Major | - | Minor | Intermediate | Intermediate |
To determine price objectives, it is also possible to use the pivot points. Here is the price position in relation to pivot points:
| Pivot points | S3 | S2 | S1 | PP | R1 | R2 | R3 |
|---|---|---|---|---|---|---|---|
| Standard | 13.178 | 13.322 | 13.398 | 13.542 | 13.618 | 13.762 | 13.838 |
| Camarilla | 13.415 | 13.435 | 13.455 | 13.475 | 13.495 | 13.515 | 13.536 |
| Woodie | 13.145 | 13.305 | 13.365 | 13.525 | 13.585 | 13.745 | 13.805 |
| Fibonacci | 13.322 | 13.406 | 13.458 | 13.542 | 13.626 | 13.678 | 13.762 |
| Pivot points | S3 | S2 | S1 | PP | R1 | R2 | R3 |
|---|---|---|---|---|---|---|---|
| Standard | 13.128 | 13.332 | 13.448 | 13.652 | 13.768 | 13.972 | 14.088 |
| Camarilla | 13.477 | 13.506 | 13.536 | 13.565 | 13.594 | 13.624 | 13.653 |
| Woodie | 13.085 | 13.310 | 13.405 | 13.630 | 13.725 | 13.950 | 14.045 |
| Fibonacci | 13.332 | 13.454 | 13.529 | 13.652 | 13.774 | 13.849 | 13.972 |
| Pivot points | S3 | S2 | S1 | PP | R1 | R2 | R3 |
|---|---|---|---|---|---|---|---|
| Standard | 12.578 | 13.022 | 13.248 | 13.692 | 13.918 | 14.362 | 14.588 |
| Camarilla | 13.291 | 13.352 | 13.414 | 13.475 | 13.536 | 13.598 | 13.659 |
| Woodie | 12.470 | 12.968 | 13.140 | 13.638 | 13.810 | 14.308 | 14.480 |
| Fibonacci | 13.022 | 13.278 | 13.436 | 13.692 | 13.948 | 14.106 | 14.362 |
Numerical data
The following is the status of technical indicators and moving averages registered at the time this technical analysis was created:
| RSI (14): | 41.95 | |
| MACD (12,26,9): | -0.0430 | |
| Directional Movement: | -3.360 | |
| AROON (14): | -64.286 | |
| DEMA (21): | 13.631 | |
| Parabolic SAR (0,02-0,02-0,2): | 14.041 | |
| Elder Ray (13): | -0.135 | |
| Super Trend (3,10): | 13.925 | |
| Zig ZAG (10): | 13.525 | |
| VORTEX (21): | 0.9310 | |
| Stochastique (14,3,5): | 5.15 | |
| TEMA (21): | 13.550 | |
| Williams %R (14): | -91.05 | |
| Chande Momentum Oscillator (20): | -0.330 | |
| Repulse (5,40,3): | -1.0660 | |
| ROCnROLL: | 2 | |
| TRIX (15,9): | 0.0010 | |
| Courbe Coppock: | 2.70 |
| MA7: | 13.558 | |
| MA20: | 13.719 | |
| MA50: | 13.647 | |
| MA100: | 13.464 | |
| MAexp7: | 13.576 | |
| MAexp20: | 13.664 | |
| MAexp50: | 13.638 | |
| MAexp100: | 13.531 | |
| Price / MA7: | -0.61% | |
| Price / MA20: | -1.78% | |
| Price / MA50: | -1.26% | |
| Price / MA100: | +0.08% | |
| Price / MAexp7: | -0.74% | |
| Price / MAexp20: | -1.38% | |
| Price / MAexp50: | -1.20% | |
| Price / MAexp100: | -0.41% |
News
The latest news and videos published on ROUGH RICE at the time of the analysis were as follows:
-
 British actor Riz Ahmed fixes his wife's hair at the Oscars
-
Ricardo Reis on One-Minute Insights: Bridging Monetary Policy Science and Practice
-
Riz Ahmed Searched at Airport Despite Being On Cover of Inflight Magazine
-
Tamir Rice's Mom Speaks Out On 2nd Anniversary Of Killing | NBC News
-
The Night Of's Riz Ahmed Says Airport Security "Attacked" Him in Emotional Essay
About author

Online


Add a comment
Comments
0 comments on the analysis ROUGH RICE - Daily