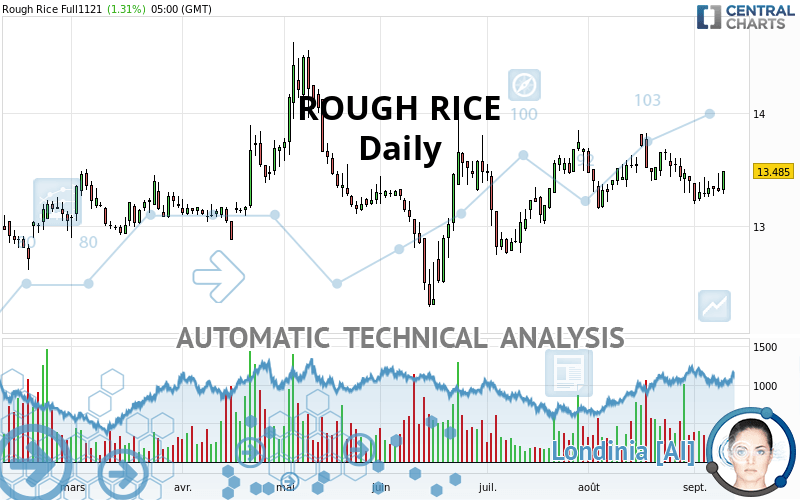
ROUGH RICE - Daily - Technical analysis published on 09/13/2021 (GMT)
- 185
- 0
Click here for a new analysis!
- Timeframe : Daily
- - Analysis generated on
- Status : TARGET REACHED

Summary of the analysis

Additional analysis
Quotes
The ROUGH RICE rating is 13.485 USD. The price has increased by +1.32% since the last closing and was traded between 13.285 USD and 13.485 USD over the period. The price is currently at +1.51% from its lowest and 0% from its highest.A bearish opening was detected by the Central Gaps scanner. Sellers are trying to impose a bearish trend in the very short term.
Bearish opening
Type : Bearish
Timeframe : Openning
So that you have an overall view of the price change, here is a table showing the variations over several periods:
Technical
A technical analysis in Daily of this ROUGH RICE chart shows a strongly bullish trend. The signals given by moving averages are 85.71% bullish. This strongly bullish trend seems to be running out of steam given the signals being given by short-term moving averages. The Central Indicators scanner detects bullish signals on moving averages that could impact this trend:
Bullish trend reversal : Moving Average 50
Type : Bullish
Timeframe : Daily
Bullish trend reversal : adaptative moving average 20
Type : Bullish
Timeframe : Daily
Bullish trend reversal : adaptative moving average 50
Type : Bullish
Timeframe : Daily
Bullish price crossover with Moving Average 20
Type : Bullish
Timeframe : Daily
Bullish price crossover with Moving Average 50
Type : Bullish
Timeframe : Daily
Bullish price crossover with Moving Average 100
Type : Bullish
Timeframe : Daily
Bullish price crossover with adaptative moving average 50
Type : Bullish
Timeframe : Daily
Bullish price crossover with adaptative moving average 100
Type : Bullish
Timeframe : Daily
In fact, of the 18 technical indicators analysed by Central Analyzer, 8 are bullish, 5 are neutral and 5 are bearish. Other results related to technical indicators were also found by the Central Indicators scanner:
RSI indicator is back over 50
Type : Bullish
Timeframe : Daily
Ichimoku : price is over the cloud
Type : Bullish
Timeframe : Daily
Price is back over the pivot point
Type : Bullish
Timeframe : Daily
Price is back over the pivot point
Type : Bullish
Timeframe : Weekly
Williams %R indicator is back over -50
Type : Bullish
Timeframe : Daily
The analysis of the price chart with Central Patterns scanners does not return any result.
No result was found by the Central Candlesticks scanner on Japanese candlesticks.
| S3 | S2 | S1 | Price | R1 | R2 | R3 | |
|---|---|---|---|---|---|---|---|
| ProTrendLines | 12.307 | 12.880 | 13.310 | 13.485 | 13.739 | 14.490 | 15.979 |
| Change (%) | -8.74% | -4.49% | -1.30% | - | +1.88% | +7.45% | +18.49% |
| Change | -1.178 | -0.605 | -0.175 | - | +0.254 | +1.005 | +2.494 |
| Level | Minor | Minor | Major | - | Intermediate | Intermediate | Minor |
Attention could also be paid to pivot points to set price objectives:
| Pivot points | S3 | S2 | S1 | PP | R1 | R2 | R3 |
|---|---|---|---|---|---|---|---|
| Standard | 13.152 | 13.218 | 13.352 | 13.418 | 13.552 | 13.618 | 13.752 |
| Camarilla | 13.430 | 13.448 | 13.467 | 13.485 | 13.503 | 13.522 | 13.540 |
| Woodie | 13.185 | 13.235 | 13.385 | 13.435 | 13.585 | 13.635 | 13.785 |
| Fibonacci | 13.218 | 13.295 | 13.342 | 13.418 | 13.495 | 13.542 | 13.618 |
| Pivot points | S3 | S2 | S1 | PP | R1 | R2 | R3 |
|---|---|---|---|---|---|---|---|
| Standard | 13.102 | 13.178 | 13.332 | 13.408 | 13.562 | 13.638 | 13.792 |
| Camarilla | 13.422 | 13.443 | 13.464 | 13.485 | 13.506 | 13.527 | 13.548 |
| Woodie | 13.140 | 13.198 | 13.370 | 13.428 | 13.600 | 13.658 | 13.830 |
| Fibonacci | 13.178 | 13.266 | 13.321 | 13.408 | 13.496 | 13.551 | 13.638 |
| Pivot points | S3 | S2 | S1 | PP | R1 | R2 | R3 |
|---|---|---|---|---|---|---|---|
| Standard | 12.303 | 12.727 | 12.973 | 13.397 | 13.643 | 14.067 | 14.313 |
| Camarilla | 13.036 | 13.097 | 13.159 | 13.220 | 13.281 | 13.343 | 13.404 |
| Woodie | 12.215 | 12.683 | 12.885 | 13.353 | 13.555 | 14.023 | 14.225 |
| Fibonacci | 12.727 | 12.983 | 13.141 | 13.397 | 13.653 | 13.811 | 14.067 |
Numerical data
The following is the status of the technical indicators and moving averages at the time of publication of this technical analysis:
| RSI (14): | 54.10 | |
| MACD (12,26,9): | -0.0090 | |
| Directional Movement: | -0.141 | |
| AROON (14): | -42.857 | |
| DEMA (21): | 13.413 | |
| Parabolic SAR (0,02-0,02-0,2): | 13.650 | |
| Elder Ray (13): | 0.080 | |
| Super Trend (3,10): | 13.181 | |
| Zig ZAG (10): | 13.500 | |
| VORTEX (21): | 0.9780 | |
| Stochastique (14,3,5): | 48.26 | |
| TEMA (21): | 13.374 | |
| Williams %R (14): | -37.50 | |
| Chande Momentum Oscillator (20): | -0.030 | |
| Repulse (5,40,3): | 0.9800 | |
| ROCnROLL: | 1 | |
| TRIX (15,9): | -0.0050 | |
| Courbe Coppock: | 2.73 |
| MA7: | 13.363 | |
| MA20: | 13.458 | |
| MA50: | 13.360 | |
| MA100: | 13.388 | |
| MAexp7: | 13.407 | |
| MAexp20: | 13.418 | |
| MAexp50: | 13.391 | |
| MAexp100: | 13.324 | |
| Price / MA7: | +0.91% | |
| Price / MA20: | +0.20% | |
| Price / MA50: | +0.94% | |
| Price / MA100: | +0.72% | |
| Price / MAexp7: | +0.58% | |
| Price / MAexp20: | +0.50% | |
| Price / MAexp50: | +0.70% | |
| Price / MAexp100: | +1.21% |
News
The latest news and videos published on ROUGH RICE at the time of the analysis were as follows:
-
 British actor Riz Ahmed fixes his wife's hair at the Oscars
-
Ricardo Reis on One-Minute Insights: Bridging Monetary Policy Science and Practice
-
Riz Ahmed Searched at Airport Despite Being On Cover of Inflight Magazine
-
Tamir Rice's Mom Speaks Out On 2nd Anniversary Of Killing | NBC News
-
The Night Of's Riz Ahmed Says Airport Security "Attacked" Him in Emotional Essay
About author

Online


Add a comment
Comments
0 comments on the analysis ROUGH RICE - Daily