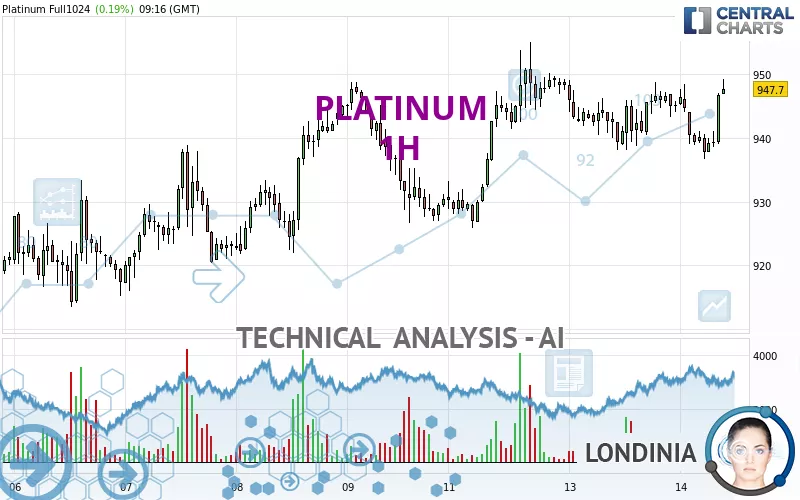
PLATINUM - 1H - Technical analysis published on 08/14/2024 (GMT)
- 98
- 0
Click here for a new analysis!
- Timeframe : 1H
- - Analysis generated on
- Status : INVALID
Summary of the analysis

Additional analysis
Quotes
The PLATINUM price is 947.70 USD. On the day, this instrument gained +0.19% and was between 936.60 USD and 949.20 USD. This implies that the price is at +1.19% from its lowest and at -0.16% from its highest.A bullish opening was detected by the Central Gaps scanner. Buyers are trying to impose a bullish momentum in the very short term.
Bullish opening
Type : Bullish
Timeframe : Openning
So that you have an overall view of the price change, here is a table showing the variations over several periods:
Near a new LOW record (1st january)
Type : Bearish
Timeframe : Weekly
Near a new LOW record (1 month)
Type : Bearish
Timeframe : Weekly
Technical
A technical analysis in 1H of this PLATINUM chart shows a strongly bullish trend. 89.29% of the signals given by moving averages are bullish. This strongly bullish trend is supported by the strong bullish signals given by short-term moving averages. The Central Indicators scanner detects bullish signals on moving averages that could impact this trend:
Bullish trend reversal : adaptative moving average 20
Type : Bullish
Timeframe : 1 hour
Bullish trend reversal : adaptative moving average 50
Type : Bullish
Timeframe : 1 hour
Bullish trend reversal : adaptative moving average 100
Type : Bullish
Timeframe : 1 hour
In fact, 12 technical indicators on 18 studied are currently bullish. Caution: the Central Indicators scanner currently detects an excess:
CCI indicator is overbought : over 100
Type : Neutral
Timeframe : 1 hour
Williams %R indicator is overbought : over -20
Type : Neutral
Timeframe : 1 hour
MACD crosses UP its Moving Average
Type : Bullish
Timeframe : 1 hour
Aroon indicator bullish trend
Type : Bullish
Timeframe : 1 hour
MACD indicator is back over 0
Type : Bullish
Timeframe : 1 hour
Price is back over the pivot point
Type : Bullish
Timeframe : Weekly
No signals are given by Central Patterns, a market scanner specialised in chart patterns, resistances and supports.
For a small setback in the very short term, the Central Candlesticks scanner currently notes the presence of this bearish pattern in Japanese candlesticks:
Bearish doji star
Type : Bearish
Timeframe : 1 hour
| S3 | S2 | S1 | Price | R1 | R2 | R3 | |
|---|---|---|---|---|---|---|---|
| ProTrendLines | 913.18 | 924.42 | 943.36 | 947.70 | 948.77 | 955.00 | 965.70 |
| Change (%) | -3.64% | -2.46% | -0.46% | - | +0.11% | +0.77% | +1.90% |
| Change | -34.52 | -23.28 | -4.34 | - | +1.07 | +7.30 | +18.00 |
| Level | Intermediate | Intermediate | Intermediate | - | Major | Intermediate | Minor |
Attention could also be paid to pivot points to set price objectives:
| Pivot points | S3 | S2 | S1 | PP | R1 | R2 | R3 |
|---|---|---|---|---|---|---|---|
| Standard | 928.23 | 933.17 | 939.53 | 944.47 | 950.83 | 955.77 | 962.13 |
| Camarilla | 942.79 | 943.83 | 944.86 | 945.90 | 946.94 | 947.97 | 949.01 |
| Woodie | 928.95 | 933.53 | 940.25 | 944.83 | 951.55 | 956.13 | 962.85 |
| Fibonacci | 933.17 | 937.48 | 940.15 | 944.47 | 948.78 | 951.45 | 955.77 |
| Pivot points | S3 | S2 | S1 | PP | R1 | R2 | R3 |
|---|---|---|---|---|---|---|---|
| Standard | 851.37 | 882.23 | 906.07 | 936.93 | 960.77 | 991.63 | 1,015.47 |
| Camarilla | 914.86 | 919.87 | 924.89 | 929.90 | 934.91 | 939.93 | 944.94 |
| Woodie | 847.85 | 880.48 | 902.55 | 935.18 | 957.25 | 989.88 | 1,011.95 |
| Fibonacci | 882.23 | 903.13 | 916.04 | 936.93 | 957.83 | 970.74 | 991.63 |
| Pivot points | S3 | S2 | S1 | PP | R1 | R2 | R3 |
|---|---|---|---|---|---|---|---|
| Standard | 805.10 | 869.90 | 920.20 | 985.00 | 1,035.30 | 1,100.10 | 1,150.40 |
| Camarilla | 938.85 | 949.40 | 959.95 | 970.50 | 981.05 | 991.60 | 1,002.15 |
| Woodie | 797.85 | 866.28 | 912.95 | 981.38 | 1,028.05 | 1,096.48 | 1,143.15 |
| Fibonacci | 869.90 | 913.87 | 941.03 | 985.00 | 1,028.97 | 1,056.13 | 1,100.10 |
Numerical data
The following is the status of the technical indicators and moving averages at the time of publication of this technical analysis:
| RSI (14): | 59.51 | |
| MACD (12,26,9): | 0.0000 | |
| Directional Movement: | 8.15 | |
| AROON (14): | -71.43 | |
| DEMA (21): | 943.10 | |
| Parabolic SAR (0,02-0,02-0,2): | 936.81 | |
| Elder Ray (13): | 4.49 | |
| Super Trend (3,10): | 937.04 | |
| Zig ZAG (10): | 948.30 | |
| VORTEX (21): | 1.0900 | |
| Stochastique (14,3,5): | 68.87 | |
| TEMA (21): | 942.81 | |
| Williams %R (14): | 0.00 | |
| Chande Momentum Oscillator (20): | 2.40 | |
| Repulse (5,40,3): | 0.9700 | |
| ROCnROLL: | 1 | |
| TRIX (15,9): | 0.0000 | |
| Courbe Coppock: | 0.42 |
| MA7: | 937.13 | |
| MA20: | 953.02 | |
| MA50: | 983.30 | |
| MA100: | 992.65 | |
| MAexp7: | 943.36 | |
| MAexp20: | 943.08 | |
| MAexp50: | 942.21 | |
| MAexp100: | 940.99 | |
| Price / MA7: | +1.13% | |
| Price / MA20: | -0.56% | |
| Price / MA50: | -3.62% | |
| Price / MA100: | -4.53% | |
| Price / MAexp7: | +0.46% | |
| Price / MAexp20: | +0.49% | |
| Price / MAexp50: | +0.58% | |
| Price / MAexp100: | +0.71% |
News
The latest news and videos published on PLATINUM at the time of the analysis were as follows:
-
 Sylvania Platinum - executive interview
-
Queen's Platinum Jubilee attempt at record for longest ever picnic at Windsor Castle
-
Platinum Jubilee: Richard Griffin on the Queen's sense of humour
-
Platinum Jubilee: Highlights from the Queen's four-day celebrations
-
Platinum Jubilee: The People's Pageant delights crowds in London
About author

Online


Add a comment
Comments
0 comments on the analysis PLATINUM - 1H