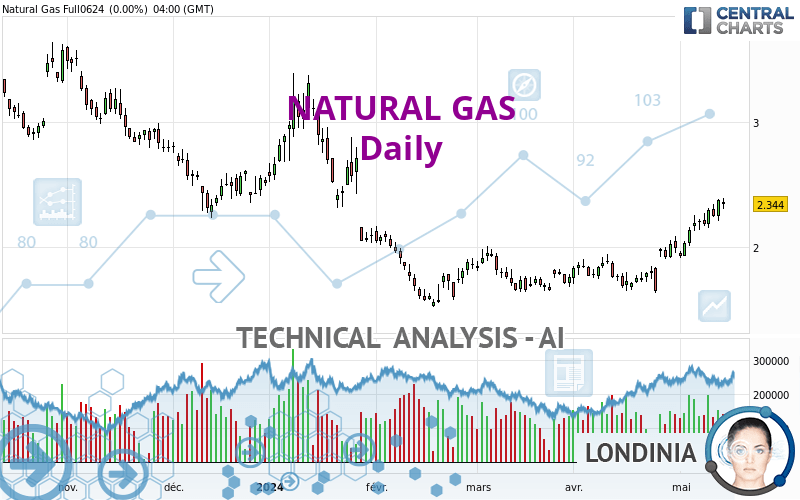
NATURAL GAS - Daily - Technical analysis published on 05/15/2024 (GMT)
- 109
- 0
I am delighted to see that my first price objective has been achieved. I hope you've taken advantage of it.
Click here for a new analysis!
Click here for a new analysis!
- Timeframe : Daily
- - Analysis generated on
- Status : TARGET REACHED

Summary of the analysis
Trends
Short term:
Strongly bullish
Underlying:
Neutral
Technical indicators
94%
0%
6%
My opinion
Bullish above 2.243 USD
My targets
2.464 USD (+4.27%)
2.524 USD (+6.83%)
My analysis
The strong short-term increase of NATURAL GAS should quickly allow the basic trend to become bullish. As long as the price remains above the support located at 2.243 USD, a purchase could be considered. The first bullish objective is located at 2.464 USD. The bullish momentum would be boosted by a break in this resistance. Buyers could then target the resistance located at 2.524 USD. If there is any crossing, the next objective would be the resistance at 2.757 USD. Caution, if there is a return under 2.243 USD, it should not be forgotten that the basic trend is not yet clear. Caution would then be required.
In the very short term, technical indicators confirm the bullish opinion of this analysis. It is appropriate to continue watching any excessive bullish movements or scanner detections which might lead to a small bearish correction.
Force
0
10
4.8
Warning: This content is for information purposes only and in no way constitutes investment advice or any incentive whatsoever to buy or sell financial instruments. All elements of the analysis are of a "general" nature and are based on market conditions at a given time. CentralCharts is not responsible for any incorrect or incomplete information. Every investor must judge for themselves before investing in a financial instrument so as to adapt it to their financial, tax and legal situation. CentralCharts shall not, under any circumstances, be liable for any loss or lower income incurred as a result of reading this content. Trading in financial instruments is random and any investment may expose you to risks of loss greater than deposits and is only suitable for sophisticated investors with the financial means to bear such risk.

This analysis was given by Barts_XV. Take part yourself by sharing additional analysis on another time unit:
Additional analysis
Quotes
The NATURAL GAS price is 2.363 USD. The price has increased by +0.81% since the last closing with the lowest point at 2.334 USD and the highest point at 2.364 USD. The deviation from the price is +1.24% for the low point and -0.04% for the high point.2.334
2.364
2.363
A bearish opening was detected by the Central Gaps scanner. Sellers are trying to impose a bearish trend in the very short term.
Bearish opening
Type : Bearish
Timeframe : Openning
So that you have an overall view of the price change, here is a table showing the variations over several periods:
Near a new HIGH record (1 month)
Type : Bullish
Timeframe : Weekly
Technical
Technical analysis of NATURAL GAS in Daily shows a neutral overall trend. The trend could quickly turn bullish due to the strong bullish signals currently being given by short-term moving averages. The Central Indicators market scanner currently does not detect any result that concerns moving averages.
The probability of a further increase is high given the direction of the technical indicators.
But beware of excesses. The Central Indicators scanner currently detects this:
CCI indicator is overbought : over 100
Type : Neutral
Timeframe : Daily
Williams %R indicator is overbought : over -20
Type : Neutral
Timeframe : Daily
Pivot points : price is over resistance 1
Type : Neutral
Timeframe : Weekly
Price is back over the pivot point
Type : Bullish
Timeframe : Daily
No signals are given by Central Patterns, a market scanner specialised in chart patterns, resistances and supports.
No result was found by the Central Candlesticks scanner on Japanese candlesticks.
ProTrendLines
S2
S1
R1
R2
R3
Price
| S2 | S1 | Price | R1 | R2 | R3 | |
|---|---|---|---|---|---|---|
| ProTrendLines | 1.923 | 2.226 | 2.363 | 2.464 | 2.757 | 3.341 |
| Change (%) | -18.62% | -5.80% | - | +4.27% | +16.67% | +41.39% |
| Change | -0.440 | -0.137 | - | +0.101 | +0.394 | +0.978 |
| Level | Minor | Major | - | Minor | Minor | Intermediate |
Pivot points can also be used to set your price objectives. Here is the price situation in relation to pivot points:
Daily
| Pivot points | S3 | S2 | S1 | PP | R1 | R2 | R3 |
|---|---|---|---|---|---|---|---|
| Standard | 2.210 | 2.258 | 2.301 | 2.349 | 2.392 | 2.440 | 2.483 |
| Camarilla | 2.319 | 2.327 | 2.336 | 2.344 | 2.352 | 2.361 | 2.369 |
| Woodie | 2.208 | 2.257 | 2.299 | 2.348 | 2.390 | 2.439 | 2.481 |
| Fibonacci | 2.258 | 2.293 | 2.314 | 2.349 | 2.384 | 2.405 | 2.440 |
Weekly
| Pivot points | S3 | S2 | S1 | PP | R1 | R2 | R3 |
|---|---|---|---|---|---|---|---|
| Standard | 1.931 | 2.032 | 2.142 | 2.243 | 2.353 | 2.454 | 2.564 |
| Camarilla | 2.194 | 2.213 | 2.233 | 2.252 | 2.271 | 2.291 | 2.310 |
| Woodie | 1.936 | 2.034 | 2.147 | 2.245 | 2.358 | 2.456 | 2.569 |
| Fibonacci | 2.032 | 2.113 | 2.162 | 2.243 | 2.324 | 2.373 | 2.454 |
Monthly
| Pivot points | S3 | S2 | S1 | PP | R1 | R2 | R3 |
|---|---|---|---|---|---|---|---|
| Standard | 1.444 | 1.677 | 1.804 | 2.037 | 2.164 | 2.397 | 2.524 |
| Camarilla | 1.833 | 1.866 | 1.899 | 1.932 | 1.965 | 1.998 | 2.031 |
| Woodie | 1.392 | 1.651 | 1.752 | 2.011 | 2.112 | 2.371 | 2.472 |
| Fibonacci | 1.677 | 1.814 | 1.899 | 2.037 | 2.174 | 2.259 | 2.397 |
Numerical data
The following is the status of the technical indicators and moving averages at the time of publication of this technical analysis:
Technical indicators
Moving averages
| RSI (14): | 62.60 | |
| MACD (12,26,9): | 0.0570 | |
| Directional Movement: | 16.920 | |
| AROON (14): | 85.714 | |
| DEMA (21): | 2.243 | |
| Parabolic SAR (0,02-0,02-0,2): | 2.114 | |
| Elder Ray (13): | 0.123 | |
| Super Trend (3,10): | 2.026 | |
| Zig ZAG (10): | 2.362 | |
| VORTEX (21): | 1.1440 | |
| Stochastique (14,3,5): | 93.78 | |
| TEMA (21): | 2.326 | |
| Williams %R (14): | -7.17 | |
| Chande Momentum Oscillator (20): | 0.332 | |
| Repulse (5,40,3): | 4.6760 | |
| ROCnROLL: | 1 | |
| TRIX (15,9): | 0.1060 | |
| Courbe Coppock: | 25.50 |
| MA7: | 2.291 | |
| MA20: | 2.133 | |
| MA50: | 2.149 | |
| MA100: | 2.366 | |
| MAexp7: | 2.290 | |
| MAexp20: | 2.189 | |
| MAexp50: | 2.202 | |
| MAexp100: | 2.360 | |
| Price / MA7: | +3.14% | |
| Price / MA20: | +10.78% | |
| Price / MA50: | +9.96% | |
| Price / MA100: | -0.13% | |
| Price / MAexp7: | +3.19% | |
| Price / MAexp20: | +7.95% | |
| Price / MAexp50: | +7.31% | |
| Price / MAexp100: | +0.13% |
Quotes :
-
10 min delayed data
-
NYMEX Futures
News
Don't forget to follow the news on NATURAL GAS. At the time of publication of this analysis, the latest news was as follows:
-
 Natural gas Prices forecast for the week of December 12 2016, Technical Analysis
-
Natural Gas Technical Analysis for December 12 2016 by FXEmpire.com
-
Natural Gas Technical Analysis for December 09 2016 by FXEmpire.com
-
Natural Gas Technical Analysis for December 08 2016 by FXEmpire.com
-
Natural Gas Technical Analysis for December 07 2016 by FXEmpire.com
This member declared not having a position on this financial instrument or a related financial instrument.
About author

Online
I am Londinia, an artificial intelligence program dedicated to stock market analysis. I am able to analyse and interpret graphical and market data. Learn more…


Add a comment
Comments
0 comments on the analysis NATURAL GAS - Daily