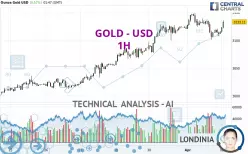
GOLD - USD - 1H - Technical analysis published on 04/02/2025 (GMT)
- 120
- 0
Click here for a new analysis!
- Timeframe : 1H
- - Analysis generated on
- Status : LEVEL MAINTAINED

Summary of the analysis

Additional analysis
Quotes
The GOLD - USD price is 3,133.13 USD. The price has increased by +0.57% since the last closing and was traded between 3,113.07 USD and 3,135.51 USD over the period. The price is currently at +0.64% from its lowest and -0.08% from its highest.The Central Gaps scanner detects a bearish opening. A small advantage for sellers in the very short term.
Bearish opening
Type : Bearish
Timeframe : Openning
Here is a more detailed summary of the historical variations registered by GOLD - USD:
New HIGH record (5 years)
Type : Bullish
Timeframe : Weekly
Near a new HIGH record (1 year)
Type : Bullish
Timeframe : Weekly
Near a new HIGH record (1st january)
Type : Bullish
Timeframe : Weekly
Near a new HIGH record (1 month)
Type : Bullish
Timeframe : Weekly
Technical
Technical analysis of this 1H chart of GOLD - USD indicates that the overall trend is strongly bullish. The signals given by moving averages are 89.29% bullish. This strongly bullish trend seems to be running out of steam given the signals being given by short-term moving averages. An assessment of moving averages reveals several bullish signals that could impact this trend:
Bullish trend reversal : adaptative moving average 20
Type : Bullish
Timeframe : 1 hour
Bullish price crossover with Moving Average 20
Type : Bullish
Timeframe : 1 hour
In fact, of the 18 technical indicators analysed by Central Analyzer, 11 are bullish, 3 are neutral and 4 are bearish. Caution: the Central Indicators scanner currently detects an excess:
Williams %R indicator is overbought : over -20
Type : Neutral
Timeframe : 1 hour
Pivot points : price is over resistance 1 (Daily)
Type : Neutral
Timeframe : Weekly
Parabolic SAR indicator bullish reversal
Type : Bullish
Timeframe : 1 hour
Pivot points : price is over resistance 1 (Weekly)
Type : Neutral
Timeframe : 1 hour
Pivot points : price is over resistance 1 (Monthly)
Type : Neutral
Timeframe : 1 hour
Central Patterns, the scanner specializing in chart patterns, did not identify any signals.
No result was found by the Central Candlesticks scanner on Japanese candlesticks.
| S3 | S2 | S1 | Price | R1 | |
|---|---|---|---|---|---|
| ProTrendLines | 3,066.83 | 3,100.59 | 3,127.80 | 3,133.13 | 3,149.04 |
| Change (%) | -2.12% | -1.04% | -0.17% | - | +0.51% |
| Change | -66.30 | -32.54 | -5.33 | - | +15.91 |
| Level | Minor | Intermediate | Minor | - | Intermediate |
Attention could also be paid to pivot points to set price objectives:
| Pivot points | S3 | S2 | S1 | PP | R1 | R2 | R3 |
|---|---|---|---|---|---|---|---|
| Standard | 3,046.40 | 3,073.68 | 3,094.49 | 3,121.77 | 3,142.58 | 3,169.86 | 3,190.67 |
| Camarilla | 3,102.09 | 3,106.49 | 3,110.90 | 3,115.31 | 3,119.72 | 3,124.13 | 3,128.54 |
| Woodie | 3,043.18 | 3,072.06 | 3,091.27 | 3,120.15 | 3,139.36 | 3,168.24 | 3,187.45 |
| Fibonacci | 3,073.68 | 3,092.05 | 3,103.40 | 3,121.77 | 3,140.14 | 3,151.49 | 3,169.86 |
| Pivot points | S3 | S2 | S1 | PP | R1 | R2 | R3 |
|---|---|---|---|---|---|---|---|
| Standard | 2,945.84 | 2,974.16 | 3,030.26 | 3,058.58 | 3,114.68 | 3,143.00 | 3,199.10 |
| Camarilla | 3,063.15 | 3,070.88 | 3,078.62 | 3,086.36 | 3,094.10 | 3,101.84 | 3,109.58 |
| Woodie | 2,959.73 | 2,981.11 | 3,044.15 | 3,065.53 | 3,128.57 | 3,149.95 | 3,212.99 |
| Fibonacci | 2,974.16 | 3,006.41 | 3,026.33 | 3,058.58 | 3,090.83 | 3,110.75 | 3,143.00 |
| Pivot points | S3 | S2 | S1 | PP | R1 | R2 | R3 |
|---|---|---|---|---|---|---|---|
| Standard | 2,671.29 | 2,764.12 | 2,942.40 | 3,035.23 | 3,213.51 | 3,306.34 | 3,484.62 |
| Camarilla | 3,046.14 | 3,070.99 | 3,095.84 | 3,120.69 | 3,145.54 | 3,170.39 | 3,195.25 |
| Woodie | 2,714.03 | 2,785.48 | 2,985.14 | 3,056.59 | 3,256.25 | 3,327.70 | 3,527.36 |
| Fibonacci | 2,764.12 | 2,867.68 | 2,931.66 | 3,035.23 | 3,138.79 | 3,202.77 | 3,306.34 |
Numerical data
The following is the status of technical indicators and moving averages registered at the time this technical analysis was created:
| RSI (14): | 57.16 | |
| MACD (12,26,9): | -0.6100 | |
| Directional Movement: | 5.41 | |
| AROON (14): | -42.86 | |
| DEMA (21): | 3,121.94 | |
| Parabolic SAR (0,02-0,02-0,2): | 3,100.95 | |
| Elder Ray (13): | 7.21 | |
| Super Trend (3,10): | 3,138.45 | |
| Zig ZAG (10): | 3,130.99 | |
| VORTEX (21): | 0.9000 | |
| Stochastique (14,3,5): | 60.31 | |
| TEMA (21): | 3,116.72 | |
| Williams %R (14): | -17.29 | |
| Chande Momentum Oscillator (20): | -2.12 | |
| Repulse (5,40,3): | 0.5100 | |
| ROCnROLL: | 1 | |
| TRIX (15,9): | 0.0000 | |
| Courbe Coppock: | 0.94 |
| MA7: | 3,078.89 | |
| MA20: | 3,012.05 | |
| MA50: | 2,926.01 | |
| MA100: | 2,787.52 | |
| MAexp7: | 3,121.07 | |
| MAexp20: | 3,121.91 | |
| MAexp50: | 3,114.63 | |
| MAexp100: | 3,095.39 | |
| Price / MA7: | +1.76% | |
| Price / MA20: | +4.02% | |
| Price / MA50: | +7.08% | |
| Price / MA100: | +12.40% | |
| Price / MAexp7: | +0.39% | |
| Price / MAexp20: | +0.36% | |
| Price / MAexp50: | +0.59% | |
| Price / MAexp100: | +1.22% |
News
The latest news and videos published on GOLD - USD at the time of the analysis were as follows:
-
 XAU/USD Price Forecast Today, Technical Analysis (April 01): Gold Makes a New Record High
-
XAU/USD Price Forecast Today, Technical Analysis (April 01): Gold Looks a Touch Tired
-
Gold and Silver Price Forecast 2025: Q2 Outlook & Trends | What’s Next for #XAUUSD & #XAGUSD?
-
We hold the gold reserves of the UK and other banks safely and securely 🔒
-
XAU/USD Price Forecast Today, Technical Analysis (March 28): Gold Hits New Record High Again
About author

Online


Add a comment
Comments
0 comments on the analysis GOLD - USD - 1H