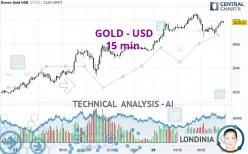
GOLD - USD - 15 min. - Technical analysis published on 03/28/2025 (GMT)
- 68
- 0
Click here for a new analysis!
- Timeframe : 15 min.
- - Analysis generated on
- Status : TARGET REACHED

Summary of the analysis

Additional analysis
Quotes
GOLD - USD rating 3,078.01 USD. On the day, this instrument gained +0.73% with the lowest point at 3,055.04 USD and the highest point at 3,086.04 USD. The deviation from the price is +0.75% for the low point and -0.26% for the high point.A bullish opening was detected by the Central Gaps scanner. Buyers are trying to impose a bullish momentum in the very short term.
Bullish opening
Type : Bullish
Timeframe : Openning
Here is a more detailed summary of the historical variations registered by GOLD - USD:
New HIGH record (5 years)
Type : Bullish
Timeframe : Weekly
New HIGH record (1 year)
Type : Bullish
Timeframe : Weekly
New HIGH record (1st january)
Type : Bullish
Timeframe : Weekly
New HIGH record (1 month)
Type : Bullish
Timeframe : Weekly
Technical
Technical analysis of GOLD - USD in 15 min. shows a strongly overall bullish trend. 89.29% of the signals given by moving averages are bullish. The slightly bullish signals given by the short-term moving averages show a weakening of the global trend. There is no crossing of moving average by the price or crossing of moving averages between themselves.
An assessment of technical indicators shows a strong bullish signal.
Central Indicators, the scanner specialised in technical indicators, has identified these signals:
Pivot points : price is over resistance 1 (Daily)
Type : Neutral
Timeframe : 15 minutes
Pivot points : price is over resistance 1 (Daily)
Type : Neutral
Timeframe : Weekly
Parabolic SAR indicator bullish reversal
Type : Bullish
Timeframe : 15 minutes
MACD indicator is back over 0
Type : Bullish
Timeframe : 15 minutes
Pivot points : price is over resistance 1 (Weekly)
Type : Neutral
Timeframe : 15 minutes
Pivot points : price is over resistance 1 (Monthly)
Type : Neutral
Timeframe : 15 minutes
No signals are given by Central Patterns, a market scanner specialised in chart patterns, resistances and supports.
Central Candlesticks, the scanner specialised in Japanese candlesticks, detects these signals that could have an impact on the current short-term trend:
Bearish harami
Type : Bearish
Timeframe : 15 minutes
Three white soldiers
Type : Bullish
Timeframe : 15 minutes
| S3 | S2 | S1 | Price | |
|---|---|---|---|---|
| ProTrendLines | 3,012.40 | 3,038.33 | 3,057.56 | 3,078.01 |
| Change (%) | -2.13% | -1.29% | -0.66% | - |
| Change | -65.61 | -39.68 | -20.45 | - |
| Level | Minor | Intermediate | Intermediate | - |
Attention could also be paid to pivot points to set price objectives:
| Pivot points | S3 | S2 | S1 | PP | R1 | R2 | R3 |
|---|---|---|---|---|---|---|---|
| Standard | 2,993.16 | 3,007.30 | 3,031.48 | 3,045.62 | 3,069.80 | 3,083.94 | 3,108.12 |
| Camarilla | 3,045.12 | 3,048.64 | 3,052.15 | 3,055.66 | 3,059.17 | 3,062.69 | 3,066.20 |
| Woodie | 2,998.18 | 3,009.81 | 3,036.50 | 3,048.13 | 3,074.82 | 3,086.45 | 3,113.14 |
| Fibonacci | 3,007.30 | 3,021.94 | 3,030.98 | 3,045.62 | 3,060.26 | 3,069.30 | 3,083.94 |
| Pivot points | S3 | S2 | S1 | PP | R1 | R2 | R3 |
|---|---|---|---|---|---|---|---|
| Standard | 2,910.14 | 2,946.18 | 2,985.41 | 3,021.45 | 3,060.68 | 3,096.72 | 3,135.95 |
| Camarilla | 3,003.95 | 3,010.85 | 3,017.75 | 3,024.65 | 3,031.55 | 3,038.45 | 3,045.35 |
| Woodie | 2,911.75 | 2,946.98 | 2,987.02 | 3,022.25 | 3,062.29 | 3,097.52 | 3,137.56 |
| Fibonacci | 2,946.18 | 2,974.93 | 2,992.69 | 3,021.45 | 3,050.20 | 3,067.96 | 3,096.72 |
| Pivot points | S3 | S2 | S1 | PP | R1 | R2 | R3 |
|---|---|---|---|---|---|---|---|
| Standard | 2,583.31 | 2,677.77 | 2,767.31 | 2,861.77 | 2,951.31 | 3,045.77 | 3,135.31 |
| Camarilla | 2,806.24 | 2,823.11 | 2,839.97 | 2,856.84 | 2,873.71 | 2,890.57 | 2,907.44 |
| Woodie | 2,580.84 | 2,676.54 | 2,764.84 | 2,860.54 | 2,948.84 | 3,044.54 | 3,132.84 |
| Fibonacci | 2,677.77 | 2,748.06 | 2,791.49 | 2,861.77 | 2,932.06 | 2,975.49 | 3,045.77 |
Numerical data
The following is the status of the technical indicators and moving averages at the time of publication of this technical analysis:
| RSI (14): | 56.50 | |
| MACD (12,26,9): | 0.4300 | |
| Directional Movement: | 3.34 | |
| AROON (14): | -21.43 | |
| DEMA (21): | 3,075.67 | |
| Parabolic SAR (0,02-0,02-0,2): | 3,066.43 | |
| Elder Ray (13): | 2.45 | |
| Super Trend (3,10): | 3,082.32 | |
| Zig ZAG (10): | 3,078.30 | |
| VORTEX (21): | 1.0000 | |
| Stochastique (14,3,5): | 63.96 | |
| TEMA (21): | 3,073.99 | |
| Williams %R (14): | -20.30 | |
| Chande Momentum Oscillator (20): | 11.74 | |
| Repulse (5,40,3): | 0.1700 | |
| ROCnROLL: | 1 | |
| TRIX (15,9): | 0.0000 | |
| Courbe Coppock: | 0.30 |
| MA7: | 3,035.60 | |
| MA20: | 2,979.17 | |
| MA50: | 2,902.60 | |
| MA100: | 2,773.89 | |
| MAexp7: | 3,075.21 | |
| MAexp20: | 3,074.78 | |
| MAexp50: | 3,071.00 | |
| MAexp100: | 3,062.38 | |
| Price / MA7: | +1.40% | |
| Price / MA20: | +3.32% | |
| Price / MA50: | +6.04% | |
| Price / MA100: | +10.96% | |
| Price / MAexp7: | +0.09% | |
| Price / MAexp20: | +0.11% | |
| Price / MAexp50: | +0.23% | |
| Price / MAexp100: | +0.51% |
News
The latest news and videos published on GOLD - USD at the time of the analysis were as follows:
-
 XAU/USD Price Forecast Today, Technical Analysis (March 27): Gold Breaks Out to New Record High
-
XAU/USD Price Forecast Today, Technical Analysis (March 27): Gold Shoots Higher on Thursday
-
Technical Outlook on Gold, EURUSD, Rolls Royce
-
XAU/USD Price Forecast Today, Technical Analysis (March 26): Consolidates Near All-Time High
-
XAU/USD Price Forecast Today, Technical Analysis (March 26): Gold Rallies Again
About author

Online


Add a comment
Comments
0 comments on the analysis GOLD - USD - 15 min.