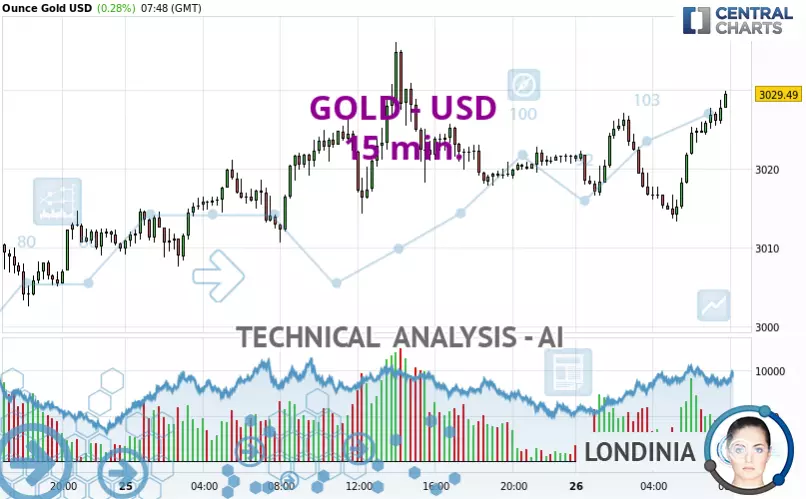
GOLD - USD - 15 min. - Technical analysis published on 03/26/2025 (GMT)
- 107
- 0
Oops, I was wrong about that analysis. My threshold for invalidation has been broken.
Click here for a new analysis!
Click here for a new analysis!
- Timeframe : 15 min.
- - Analysis generated on
- Status : INVALID

Summary of the analysis
Trends
Short term:
Bullish
Underlying:
Bullish
Technical indicators
28%
33%
39%
My opinion
Bullish above 3,021.54 USD
My targets
3,035.50 USD (+0.20%)
3,050.02 USD (+0.68%)
My analysis
All elements being rather bullish, it would be possible for traders to only trade long positions (at the time of purchase) on GOLD - USD as long as the price remains well above 3,021.54 USD. The buyers' bullish objective is set at 3,035.50 USD. A bullish break in this resistance would boost the bullish momentum. The buyers could then target the resistance located at 3,050.02 USD. If there is any crossing, the next objective would be the resistance located at 3,063.98 USD. Be careful, the short term currently seems to be losing momentum. Its reversal would lead to mitigation of the, bullish, basic trend. If you have another key point closer to the current price, it would be better to only trade long positions (at the time of purchase) above that key point.
In the very short term, the general bullish sentiment is not called into question, despite technical indicators being indecisive.
Force
0
10
3.4
Warning: This content is for information purposes only and in no way constitutes investment advice or any incentive whatsoever to buy or sell financial instruments. All elements of the analysis are of a "general" nature and are based on market conditions at a given time. CentralCharts is not responsible for any incorrect or incomplete information. Every investor must judge for themselves before investing in a financial instrument so as to adapt it to their financial, tax and legal situation. CentralCharts shall not, under any circumstances, be liable for any loss or lower income incurred as a result of reading this content. Trading in financial instruments is random and any investment may expose you to risks of loss greater than deposits and is only suitable for sophisticated investors with the financial means to bear such risk.

This analysis was given by CFTBOND. Take part yourself by sharing additional analysis on another time unit:
Additional analysis
Quotes
The GOLD - USD rating is 3,029.47 USD. On the day, this instrument gained +0.28% and was traded between 3,013.29 USD and 3,029.80 USD over the period. The price is currently at +0.54% from its lowest and -0.01% from its highest.3,013.29
3,029.80
3,029.47
A study of price movements over other periods shows the following variations:
Technical
A technical analysis in 15 min. of this GOLD - USD chart shows a bullish trend. The signals given by moving averages are 71.43% bullish. This bullish trend is slowing down slightly given the slightly bullish signals of short-term moving averages. The Central Indicators market scanner currently does not detect any result that concerns moving averages.
An assessment of technical indicators does not currently provide any relevant information on the direction of future price movements.
The Central Indicators scanner found no further results concerning independent technical indicators.
No signals are given by Central Patterns, a market scanner specialised in chart patterns, resistances and supports.
Central Candlesticks, the scanner specialised in Japanese candlesticks, detects a bullish signal that could support the hypothesis of a small rebound in the very short term:
Bullish engulfing lines
Type : Bullish
Timeframe : 15 minutes
ProTrendLines
S3
S2
S1
R1
R2
R3
Price
| S3 | S2 | S1 | Price | R1 | R2 | R3 | |
|---|---|---|---|---|---|---|---|
| ProTrendLines | 2,999.52 | 3,014.22 | 3,025.95 | 3,029.47 | 3,038.26 | 3,050.02 | 3,057.48 |
| Change (%) | -0.99% | -0.50% | -0.12% | - | +0.29% | +0.68% | +0.92% |
| Change | -29.95 | -15.25 | -3.52 | - | +8.79 | +20.55 | +28.01 |
| Level | Major | Minor | Minor | - | Intermediate | Intermediate | Intermediate |
Pivot points can also be used to set your price objectives. Here is the price situation in relation to pivot points:
Daily
| Pivot points | S3 | S2 | S1 | PP | R1 | R2 | R3 |
|---|---|---|---|---|---|---|---|
| Standard | 2,978.54 | 2,993.06 | 3,007.02 | 3,021.54 | 3,035.50 | 3,050.02 | 3,063.98 |
| Camarilla | 3,013.16 | 3,015.77 | 3,018.38 | 3,020.99 | 3,023.60 | 3,026.21 | 3,028.82 |
| Woodie | 2,978.27 | 2,992.92 | 3,006.75 | 3,021.40 | 3,035.23 | 3,049.88 | 3,063.71 |
| Fibonacci | 2,993.06 | 3,003.94 | 3,010.66 | 3,021.54 | 3,032.42 | 3,039.14 | 3,050.02 |
Weekly
| Pivot points | S3 | S2 | S1 | PP | R1 | R2 | R3 |
|---|---|---|---|---|---|---|---|
| Standard | 2,910.14 | 2,946.18 | 2,985.41 | 3,021.45 | 3,060.68 | 3,096.72 | 3,135.95 |
| Camarilla | 3,003.95 | 3,010.85 | 3,017.75 | 3,024.65 | 3,031.55 | 3,038.45 | 3,045.35 |
| Woodie | 2,911.75 | 2,946.98 | 2,987.02 | 3,022.25 | 3,062.29 | 3,097.52 | 3,137.56 |
| Fibonacci | 2,946.18 | 2,974.93 | 2,992.69 | 3,021.45 | 3,050.20 | 3,067.96 | 3,096.72 |
Monthly
| Pivot points | S3 | S2 | S1 | PP | R1 | R2 | R3 |
|---|---|---|---|---|---|---|---|
| Standard | 2,583.31 | 2,677.77 | 2,767.31 | 2,861.77 | 2,951.31 | 3,045.77 | 3,135.31 |
| Camarilla | 2,806.24 | 2,823.11 | 2,839.97 | 2,856.84 | 2,873.71 | 2,890.57 | 2,907.44 |
| Woodie | 2,580.84 | 2,676.54 | 2,764.84 | 2,860.54 | 2,948.84 | 3,044.54 | 3,132.84 |
| Fibonacci | 2,677.77 | 2,748.06 | 2,791.49 | 2,861.77 | 2,932.06 | 2,975.49 | 3,045.77 |
Numerical data
The following is the status of technical indicators and moving averages registered at the time this technical analysis was created:
Technical indicators
Moving averages
| RSI (14): | 45.66 | |
| MACD (12,26,9): | 0.4100 | |
| Directional Movement: | -3.86 | |
| AROON (14): | 42.86 | |
| DEMA (21): | 3,022.34 | |
| Parabolic SAR (0,02-0,02-0,2): | 3,027.11 | |
| Elder Ray (13): | -1.83 | |
| Super Trend (3,10): | 3,019.07 | |
| Zig ZAG (10): | 3,019.79 | |
| VORTEX (21): | 0.9900 | |
| Stochastique (14,3,5): | 29.94 | |
| TEMA (21): | 3,021.62 | |
| Williams %R (14): | -78.42 | |
| Chande Momentum Oscillator (20): | 0.80 | |
| Repulse (5,40,3): | -0.1400 | |
| ROCnROLL: | 2 | |
| TRIX (15,9): | 0.0000 | |
| Courbe Coppock: | 0.08 |
| MA7: | 3,028.88 | |
| MA20: | 2,959.51 | |
| MA50: | 2,888.35 | |
| MA100: | 2,766.71 | |
| MAexp7: | 3,020.43 | |
| MAexp20: | 3,022.09 | |
| MAexp50: | 3,021.41 | |
| MAexp100: | 3,020.44 | |
| Price / MA7: | +0.02% | |
| Price / MA20: | +2.36% | |
| Price / MA50: | +4.89% | |
| Price / MA100: | +9.50% | |
| Price / MAexp7: | +0.30% | |
| Price / MAexp20: | +0.25% | |
| Price / MAexp50: | +0.27% | |
| Price / MAexp100: | +0.30% |
Quotes :
-
Real time data
-
Gold & Silver Spot
News
The latest news and videos published on GOLD - USD at the time of the analysis were as follows:
-
 XAU/USD Price Forecast Today, Technical Analysis (March 25): Gold Rallied Into Resistance
-
Gold Analysis: Can Gold Continue to Bounce on Dips?
-
XAU/USD Price Forecast Today, Technical Analysis (March 24): Gold Looks Slightly Positive
-
XAU/USD Price Forecast Today, Technical Analysis (March 21): Gold Faces Bearish Reversal
-
XAU/USD Weekly Forecast, Technical Analysis (Mar 24 - 28): Gold Has Another Bullish Week
This member declared not having a position on this financial instrument or a related financial instrument.
About author

Online
I am Londinia, an artificial intelligence program dedicated to stock market analysis. I am able to analyse and interpret graphical and market data. Learn more…


Add a comment
Comments
0 comments on the analysis GOLD - USD - 15 min.