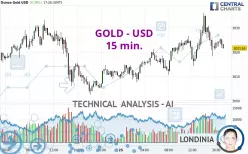
GOLD - USD - 15 min. - Technical analysis published on 03/25/2025 (GMT)
- 80
- 0
Click here for a new analysis!
- Timeframe : 15 min.
- - Analysis generated on
- Status : LEVEL MAINTAINED

Summary of the analysis

Additional analysis
Quotes
The GOLD - USD rating is 3,021.61 USD. On the day, this instrument gained +0.39% and was traded between 3,007.57 USD and 3,036.05 USD over the period. The price is currently at +0.47% from its lowest and -0.48% from its highest.The Central Gaps scanner detects a bullish opening. A small advantage for buyers in the very short term.
Bullish opening
Type : Bullish
Timeframe : Openning
Here is a more detailed summary of the historical variations registered by GOLD - USD:
Near a new HIGH record (5 years)
Type : Bullish
Timeframe : Weekly
Near a new HIGH record (1 year)
Type : Bullish
Timeframe : Weekly
Near a new HIGH record (1st january)
Type : Bullish
Timeframe : Weekly
Near a new HIGH record (1 month)
Type : Bullish
Timeframe : Weekly
Technical
Technical analysis of this 15 min. chart of GOLD - USD indicates that the overall trend is bullish. 75.00% of the signals given by moving averages are bullish. Caution: the neutral signals currently given by short-term moving averages show us that the global trend is losing momentum. There is no crossing of moving average by the price or crossing of moving averages between themselves.
In fact, only 9 technical indicators out of 18 studied are currently positioned bearish. Central Indicators, the detector scanner for these technical indicators recently detected a signal:
Ichimoku - Bearish crossover : Tenkan & Kijun
Type : Bearish
Timeframe : 15 minutes
Central Patterns, the scanner specializing in chart patterns, did not identify any signals.
For a small rebound in the very short term, the Central Candlesticks scanner currently notes the presence of these bullish patterns in Japanese candlesticks:
Bullish harami
Type : Bullish
Timeframe : 15 minutes
Bullish harami cross
Type : Bullish
Timeframe : 15 minutes
Bullish engulfing lines
Type : Bullish
Timeframe : 15 minutes
| S3 | S2 | S1 | Price | R1 | R2 | R3 | |
|---|---|---|---|---|---|---|---|
| ProTrendLines | 2,981.60 | 2,999.83 | 3,014.21 | 3,021.61 | 3,025.95 | 3,038.26 | 3,057.48 |
| Change (%) | -1.32% | -0.72% | -0.24% | - | +0.14% | +0.55% | +1.19% |
| Change | -40.01 | -21.78 | -7.40 | - | +4.34 | +16.65 | +35.87 |
| Level | Minor | Major | Minor | - | Minor | Intermediate | Intermediate |
Attention could also be paid to pivot points to set price objectives:
| Pivot points | S3 | S2 | S1 | PP | R1 | R2 | R3 |
|---|---|---|---|---|---|---|---|
| Standard | 2,966.33 | 2,984.41 | 2,997.15 | 3,015.23 | 3,027.97 | 3,046.05 | 3,058.79 |
| Camarilla | 3,001.43 | 3,004.25 | 3,007.08 | 3,009.90 | 3,012.73 | 3,015.55 | 3,018.38 |
| Woodie | 2,963.67 | 2,983.08 | 2,994.49 | 3,013.90 | 3,025.31 | 3,044.72 | 3,056.13 |
| Fibonacci | 2,984.41 | 2,996.18 | 3,003.45 | 3,015.23 | 3,027.00 | 3,034.27 | 3,046.05 |
| Pivot points | S3 | S2 | S1 | PP | R1 | R2 | R3 |
|---|---|---|---|---|---|---|---|
| Standard | 2,910.14 | 2,946.18 | 2,985.41 | 3,021.45 | 3,060.68 | 3,096.72 | 3,135.95 |
| Camarilla | 3,003.95 | 3,010.85 | 3,017.75 | 3,024.65 | 3,031.55 | 3,038.45 | 3,045.35 |
| Woodie | 2,911.75 | 2,946.98 | 2,987.02 | 3,022.25 | 3,062.29 | 3,097.52 | 3,137.56 |
| Fibonacci | 2,946.18 | 2,974.93 | 2,992.69 | 3,021.45 | 3,050.20 | 3,067.96 | 3,096.72 |
| Pivot points | S3 | S2 | S1 | PP | R1 | R2 | R3 |
|---|---|---|---|---|---|---|---|
| Standard | 2,583.31 | 2,677.77 | 2,767.31 | 2,861.77 | 2,951.31 | 3,045.77 | 3,135.31 |
| Camarilla | 2,806.24 | 2,823.11 | 2,839.97 | 2,856.84 | 2,873.71 | 2,890.57 | 2,907.44 |
| Woodie | 2,580.84 | 2,676.54 | 2,764.84 | 2,860.54 | 2,948.84 | 3,044.54 | 3,132.84 |
| Fibonacci | 2,677.77 | 2,748.06 | 2,791.49 | 2,861.77 | 2,932.06 | 2,975.49 | 3,045.77 |
Numerical data
The following is the status of technical indicators and moving averages registered at the time this technical analysis was created:
| RSI (14): | 48.39 | |
| MACD (12,26,9): | 0.2900 | |
| Directional Movement: | 0.70 | |
| AROON (14): | -42.86 | |
| DEMA (21): | 3,024.20 | |
| Parabolic SAR (0,02-0,02-0,2): | 3,031.37 | |
| Elder Ray (13): | -1.22 | |
| Super Trend (3,10): | 3,018.99 | |
| Zig ZAG (10): | 3,022.39 | |
| VORTEX (21): | 1.0700 | |
| Stochastique (14,3,5): | 24.37 | |
| TEMA (21): | 3,023.02 | |
| Williams %R (14): | -77.31 | |
| Chande Momentum Oscillator (20): | -6.04 | |
| Repulse (5,40,3): | -0.0500 | |
| ROCnROLL: | -1 | |
| TRIX (15,9): | 0.0000 | |
| Courbe Coppock: | 0.19 |
| MA7: | 3,026.42 | |
| MA20: | 2,954.39 | |
| MA50: | 2,881.83 | |
| MA100: | 2,763.87 | |
| MAexp7: | 3,022.96 | |
| MAexp20: | 3,023.42 | |
| MAexp50: | 3,021.45 | |
| MAexp100: | 3,019.87 | |
| Price / MA7: | -0.16% | |
| Price / MA20: | +2.28% | |
| Price / MA50: | +4.85% | |
| Price / MA100: | +9.33% | |
| Price / MAexp7: | -0.04% | |
| Price / MAexp20: | -0.06% | |
| Price / MAexp50: | +0.01% | |
| Price / MAexp100: | +0.06% |
News
The last news published on GOLD - USD at the time of the generation of this analysis was as follows:
-
 Gold Analysis: Can Gold Continue to Bounce on Dips?
-
XAU/USD Price Forecast Today, Technical Analysis (March 24): Gold Looks Slightly Positive
-
XAU/USD Price Forecast Today, Technical Analysis (March 21): Gold Faces Bearish Reversal
-
XAU/USD Weekly Forecast, Technical Analysis (Mar 24 - 28): Gold Has Another Bullish Week
-
XAU/USD Price Forecast Today, Technical Analysis (March 21): Gold Pulls Back Slightly
About author

Online


Add a comment
Comments
0 comments on the analysis GOLD - USD - 15 min.