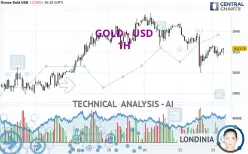
GOLD - USD - 1H - Technical analysis published on 03/24/2025 (GMT)
- 76
- 0
- Timeframe : 1H
- - Analysis generated on
- Status : NEUTRAL

Summary of the analysis

Additional analysis
Quotes
The GOLD - USD price is 3,023.20 USD. The price is lower by -0.05% since the last closing with the lowest point at 3,013.79 USD and the highest point at 3,026.36 USD. The deviation from the price is +0.31% for the low point and -0.10% for the high point.A bullish opening was detected by the Central Gaps scanner. Buyers are trying to impose a bullish momentum in the very short term.
Bullish opening
Type : Bullish
Timeframe : Openning
So that you have an overall view of the price change, here is a table showing the variations over several periods:
Near a new HIGH record (5 years)
Type : Bullish
Timeframe : Weekly
Near a new HIGH record (1 year)
Type : Bullish
Timeframe : Weekly
Near a new HIGH record (1st january)
Type : Bullish
Timeframe : Weekly
Near a new HIGH record (1 month)
Type : Bullish
Timeframe : Weekly
Technical
Technical analysis of this 1H chart of GOLD - USD indicates that the overall trend is slightly bearish. Only 53.57% of the signals given by moving averages are bearish. This slightly bearish trend could return to neutral given the neutral signals also given by short-term moving averages. The Central Indicators market scanner is currently detecting a bearish signal that could impact this trend:
Bearish price crossover with Moving Average 20
Type : Bearish
Timeframe : 1 hour
An assessment of technical indicators does not currently provide any relevant information to suggest whether the signal given by the technical indicators is more bullish or bearish.
Other results related to technical indicators were also found by the Central Indicators scanner:
Price is back under the pivot point (Daily)
Type : Bearish
Timeframe : Weekly
Price is back under the pivot point (Weekly)
Type : Bearish
Timeframe : 1 hour
The analysis of the price chart with Central Patterns scanners does not return any result.
There is also a Japanese candlestick pattern detected by Central Candlesticks that could mark the end of the current short-term trend:
Doji
Type : Neutral
Timeframe : 1 hour
| S3 | S2 | S1 | Price | R1 | R2 | |
|---|---|---|---|---|---|---|
| ProTrendLines | 2,950.03 | 2,999.83 | 3,022.52 | 3,023.20 | 3,038.24 | 3,057.48 |
| Change (%) | -2.42% | -0.77% | -0.02% | - | +0.50% | +1.13% |
| Change | -73.17 | -23.37 | -0.68 | - | +15.04 | +34.28 |
| Level | Intermediate | Major | Minor | - | Intermediate | Minor |
Attention could also be paid to pivot points to set price objectives:
| Pivot points | S3 | S2 | S1 | PP | R1 | R2 | R3 |
|---|---|---|---|---|---|---|---|
| Standard | 2,952.24 | 2,975.88 | 3,000.27 | 3,023.91 | 3,048.30 | 3,071.94 | 3,096.33 |
| Camarilla | 3,011.44 | 3,015.85 | 3,020.25 | 3,024.65 | 3,029.05 | 3,033.46 | 3,037.86 |
| Woodie | 2,952.61 | 2,976.07 | 3,000.64 | 3,024.10 | 3,048.67 | 3,072.13 | 3,096.70 |
| Fibonacci | 2,975.88 | 2,994.23 | 3,005.57 | 3,023.91 | 3,042.26 | 3,053.60 | 3,071.94 |
| Pivot points | S3 | S2 | S1 | PP | R1 | R2 | R3 |
|---|---|---|---|---|---|---|---|
| Standard | 2,910.14 | 2,946.18 | 2,985.41 | 3,021.45 | 3,060.68 | 3,096.72 | 3,135.95 |
| Camarilla | 3,003.95 | 3,010.85 | 3,017.75 | 3,024.65 | 3,031.55 | 3,038.45 | 3,045.35 |
| Woodie | 2,911.75 | 2,946.98 | 2,987.02 | 3,022.25 | 3,062.29 | 3,097.52 | 3,137.56 |
| Fibonacci | 2,946.18 | 2,974.93 | 2,992.69 | 3,021.45 | 3,050.20 | 3,067.96 | 3,096.72 |
| Pivot points | S3 | S2 | S1 | PP | R1 | R2 | R3 |
|---|---|---|---|---|---|---|---|
| Standard | 2,583.31 | 2,677.77 | 2,767.31 | 2,861.77 | 2,951.31 | 3,045.77 | 3,135.31 |
| Camarilla | 2,806.24 | 2,823.11 | 2,839.97 | 2,856.84 | 2,873.71 | 2,890.57 | 2,907.44 |
| Woodie | 2,580.84 | 2,676.54 | 2,764.84 | 2,860.54 | 2,948.84 | 3,044.54 | 3,132.84 |
| Fibonacci | 2,677.77 | 2,748.06 | 2,791.49 | 2,861.77 | 2,932.06 | 2,975.49 | 3,045.77 |
Numerical data
The following are the details of the technical indicators and moving averages that were collected to generate this technical analysis:
| RSI (14): | 43.33 | |
| MACD (12,26,9): | -3.9800 | |
| Directional Movement: | -17.58 | |
| AROON (14): | -14.29 | |
| DEMA (21): | 3,017.01 | |
| Parabolic SAR (0,02-0,02-0,2): | 3,025.68 | |
| Elder Ray (13): | -2.91 | |
| Super Trend (3,10): | 3,036.08 | |
| Zig ZAG (10): | 3,017.43 | |
| VORTEX (21): | 0.9600 | |
| Stochastique (14,3,5): | 49.42 | |
| TEMA (21): | 3,016.24 | |
| Williams %R (14): | -51.67 | |
| Chande Momentum Oscillator (20): | 1.60 | |
| Repulse (5,40,3): | -0.1900 | |
| ROCnROLL: | 2 | |
| TRIX (15,9): | -0.0200 | |
| Courbe Coppock: | 0.30 |
| MA7: | 3,021.62 | |
| MA20: | 2,949.61 | |
| MA50: | 2,875.06 | |
| MA100: | 2,761.07 | |
| MAexp7: | 3,018.97 | |
| MAexp20: | 3,022.80 | |
| MAexp50: | 3,028.08 | |
| MAexp100: | 3,022.55 | |
| Price / MA7: | +0.05% | |
| Price / MA20: | +2.49% | |
| Price / MA50: | +5.15% | |
| Price / MA100: | +9.49% | |
| Price / MAexp7: | +0.14% | |
| Price / MAexp20: | +0.01% | |
| Price / MAexp50: | -0.16% | |
| Price / MAexp100: | +0.02% |
News
Don't forget to follow the news on GOLD - USD. At the time of publication of this analysis, the latest news was as follows:
-
 XAU/USD Price Forecast Today, Technical Analysis (March 21): Gold Faces Bearish Reversal
-
XAU/USD Weekly Forecast, Technical Analysis (Mar 24 - 28): Gold Has Another Bullish Week
-
XAU/USD Price Forecast Today, Technical Analysis (March 21): Gold Pulls Back Slightly
-
XAU/USD Price Forecast Today, Technical Analysis (March 20): Gold Hits Record but Momentum Stalls
-
XAU/USD Price Forecast Today, Technical Analysis (March 20): Gold Continues to Bounce Around
About author

Online


Add a comment
Comments
0 comments on the analysis GOLD - USD - 1H